Facebook - Shot Across The Bow - RIP?
Companies / Tech Stocks Dec 30, 2013 - 04:34 AM GMTBy: Michael_Noonan
 One can never read tomorrow's news today, but developing market activity can give one a higher degree of probability as to what, if not tomorrow's then what the news will soon be sometime after. Facebook is a case in point. The Guardian ran an article on Friday, the 27th, giving an author's opinion that Facebook "is dead and buried to teens." If one were long that stock, the level of concern should run to high alert, for Facebook has no product, other than a social venue, and social "values" can change quickly, especially among teens.
Does a market send a message to exit from a position? We say a resounding Yes! There may be some room as to when, but if there is some kind of red flag alert, then one should have a set of rules in place to protect against potential adversity. Is Facebook sending such an alert? You be the judge.
A little bit of background can be helpful. Almost everyone focuses on price, certainly a key element in decision-making. Not as many focus on volume, primarily due to a lack of understanding. Volume is the energy, or lack of energy behind price. Volume reflects two key elements: supply and demand.
You want to see volume expanding as price rises, the market's way of acknowledging the effort from buyers is greater than that of sellers. When price sells off, as in a correction, the level of volume should decrease. This tells you there is some selling, normal for any correction, and the decrease in volume says there are less sellers as price recedes than there are buyers as price rallies.
There are also times when volume appears out of line with market activity. One such example is a spike in volume. A sharp increase in volume with a widening of the price range is normal. A sharp increase in volume with a small trading range in not. It is a message from the market that something unusual occurred, and the event needs to be put into a market context.
Here is the article from The Guardian, that ran on Friday, that sends up a red flag for anyone long that stock, because the message is, "Facebook is not just on the slide - it is basically dead and buried," wrote Daniel Miller, lead anthropologist on the research team, who is professor of material culture of University College London.
We have no position in Facebook, but the message peaked our curiosity to see if the market were sending its own message. In the markets, as in life, there are no accidents. It is simply a matter of paying attention whenever something out of the norm appears.
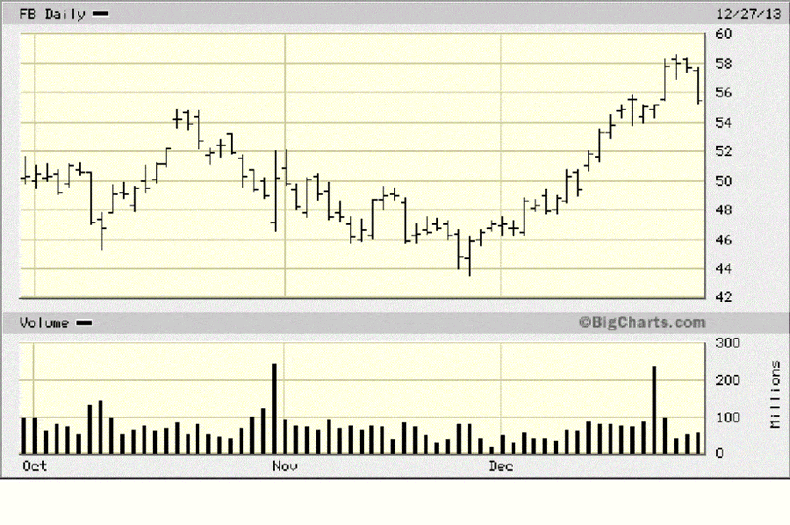
Before going any further, take a look at the daily chart, below. The market is the best and most reliable source for information. It sends out messages every day, and there are always a few days that are more information relevant than others. Best of all, the info is available to everyone, at the same time. Do you see any reason why you may not want to be long Facebook?

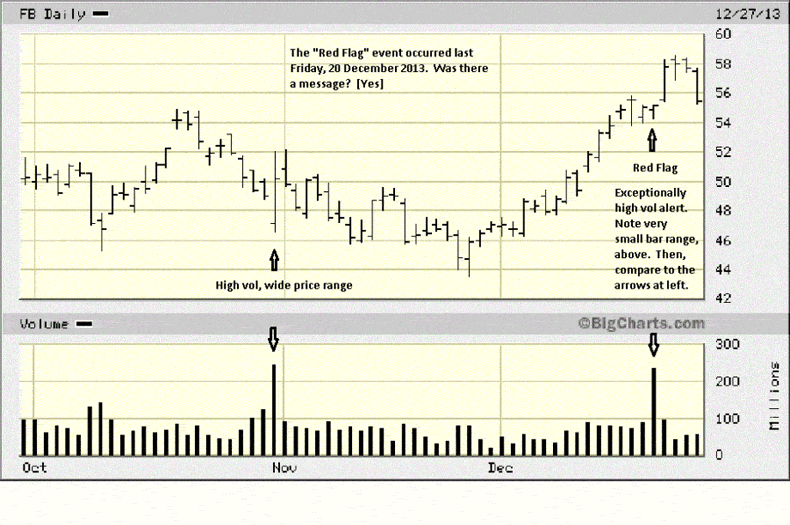
If you could not see what information the market was sending, the next chart explains.
You can see from the next daily chart that there was an unusually strong volume spike on Friday, 20 December 2013. We may not be reading tomorrow's news as of that date, but we are definitely reading some news of what may occur in the near future, and if one wants to have an edge in decision-making, here it is.
Why should one be on high alert once that specific day? The very small price range is way out of line given the enormous volume effort. Think of it this way: normal volume effort averages around 85 million per day, [see bottom of chart]. On 20 December, the level of buying increased to about 220 million. Over twice as many buyers entered the market, but the response in price was a very small trading range, and unchanged from the day before.
The markets are full of logic. If you knew the average number of buyers were easily under 100 million per day, what would you expect the reaction to be if the number of buyers all of a sudden increased to almost 250%? Maybe a strong rally should develop?
What actually happened?
The price range was much smaller than the typical daily range. Why? Only one answer:
Sellers.
The number of sellers was more than a match for the number of buyers. Why more than a match? The effort of the sellers not only stopped the buyers, the selling was so strong that the abnormal level of volume was totally contained. Buyers were unable to push price any higher than unchanged from the previous day due to the increased level of selling. That raises the next question. Who was doing the selling?
Smart money.
Why smart money? Because the public does not sell in a concerted effort like that. Why would smart money be selling? Expectations are for the stock to drop in value, lower than where they sold. But price continued to rally. Smart money cannot unload [distribute] their holdings at one time. They need to sell on the way up.
We cannot know what smart money knows, but we can know, for the most part, when smart money is active because they leave "footprints," like this level of volume that stands out like a sore thumb.
There was a similar volume spike in November. Compare the size of each respective price range. November's was much larger, in line with the volume effort. Even then, the market provided important information. The close was off the high, indicating sellers were active. The biggest tell was the lack of upside gain relative to the effort, and that observation was confirmed, next day, when there was no more upside follow through.
Back to Friday, the 20th, and the huge volume increase.
The next bar was a relatively strong rally higher. What followed? Two more days of price moving sideways, with closes clustering at the same level. A clustering of closes is often a balance between buyers and sellers. It can lead to continuation, or to change. There was a red flag bar four days earlier for context. All that is needed is confirmation, and next day, Friday, price opened lower and did not look back.
All we are doing is reading the market activity as it evolves, based on established facts. There is no guesswork involved. No one had "tomorrow's" newspaper, but there was an alert sent out on the previous Friday, 20 December. This was an edge for the prepared. As it turns out a new article did appear a week later.
The close from Friday, the 27th, erased the previous three days of trading, and it also negated the positive rally and increased volume three days earlier. We had a clue from a week earlier, and the intra day chart adds more to the next directional move.
How to respond to the information? It depends on what your trading rules are. If long, and you have profits, one possibility is to take at least partial profits and close stops on the balance.
The level of the overall market is the highest it has been, except for the Nasdaq, and this is a Nasdaq stock. The market could be subject to a correction, at any time, so one needs to have their own plan for how to deal with changing market parameters. Price could rally to new highs, next week. It does not seem likely, but anything can happen at any time.
The message is to always be prepared to receive the information messages the market is sending, each and every day.

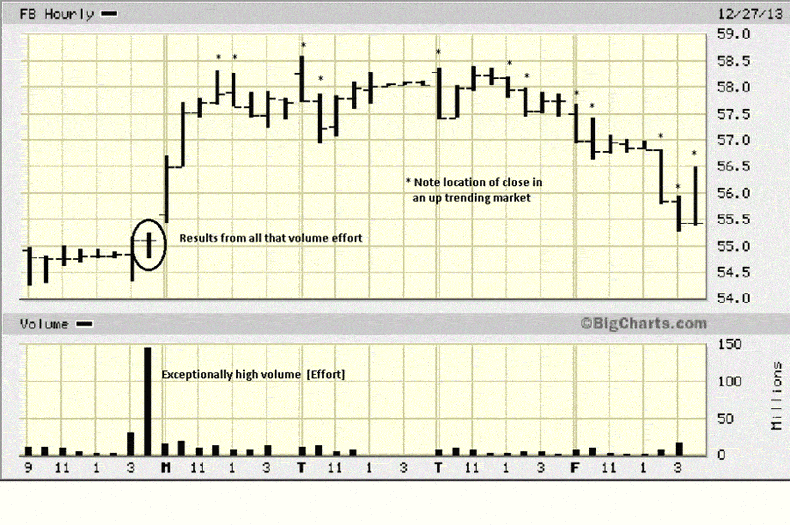
The use of intra day charts can sometimes provide more details. The bulk of the sharp volume increase occurred during the last trading hour, circled, and price barely budged from the previous hour. The message was clear, for anyone to see and when it happened, in real time.
Mention was made about a clustering of closes signifying balance, either for continuation or change. From balance comes unbalance. Looking at the intra day chart, we put "*" over specific bars, and these bars had lower range closes. Lower range closes tells us that sellers won the "battle of the bar," [in whatever time frame]. The widest range bars had lower range closes, consistently. If there is a degree of balance between bus and sellers, and you see sellers are "winning" the battle, would you surmise buyers or sellers were in control?
The way to respond all depends on your own rules for the developing situation.

By Michael Noonan
Michael Noonan, mn@edgetraderplus.com, is a Chicago-based trader with over 30 years in the business. His sole approach to analysis is derived from developing market pattern behavior, found in the form of Price, Volume, and Time, and it is generated from the best source possible, the market itself.
© 2013 Copyright Michael Noonan - All Rights Reserved Disclaimer: The above is a matter of opinion provided for general information purposes only and is not intended as investment advice. Information and analysis above are derived from sources and utilising methods believed to be reliable, but we cannot accept responsibility for any losses you may incur as a result of this analysis. Individuals should consult with their personal financial advisors.
Michael Noonan Archive |
© 2005-2022 http://www.MarketOracle.co.uk - The Market Oracle is a FREE Daily Financial Markets Analysis & Forecasting online publication.


