Malaysia Bracing for Possible Indonesia Economic Meltdown
Economics / Asian Economies Dec 29, 2013 - 12:39 PM GMTBy: Sam_Chee_Kong
 Indonesia is the fifth largest economy in Asia and the fourth most populous country in the world. Thanks to the strong macro-economic reform and liberalization of its international trade. As a result a strong economic growth to the tune of 6-8% is achievable for the past few years. Since the last Asian Financial Crisis, Indonesia has made much stride in poverty eradication, economic growth and human capital development. To stabilize prices, Monetary Policy tools such as interest rates, liquidity management and macro-prudential measures are used. Other measures taken to ensure sustainable economic growth includes raising minimum wage, reduction in fuel subsidies, electricity and other essential items, increase cash payment to low income group and broaden the tax base.
To broaden its tax base, Indonesia currently applies export taxes on palm oil and cocoa and selected minerals. Another measure taken is the reduction of the number of tax exempt items from the VAT list. Due to the past policy of increasing the number of items to be tax exempt from VAT, there is a considerable loss of revenue from this sector. Other measures to boost economic growth includes implementing a more transparent public procurement, export subsidy and import restriction, local content requirement and the promotion of FDI. This is in line with the Indonesian Government’s effort and objective to achieve the target of making Indonesia the fifth largest economy in the world.
Despite making some progress through the years, however the Indonesian economy has been experiencing diminishing returns in its economic growth. As of late the Indonesian economy has been experiencing a slowdown due to external factors such as slowing down of the global economy that is also affecting its major trading partners. Internal factors such as flip-flopping Public Policies, rise in corruption and policy failures in achieving its social objective such as the reduction in income disparity between the rich and poor, raising the wage level to compensate spiraling inflation and price stabilization.
In addition, recent large Government budget deficits has led it to implement protectionism policy such as requiring foreign investors to sell down their stakes in mining operations within a 10 year time frame and also the capping on foreign ownership in financial institutions also contributed to the recent economic rout. A good example is the collapsed of the recent takeover bid by Singapore’s DBS for Indonesia’s Danamon Bank. New rules are implemented recently such as delaying and complicating the process for foreign banks acquiring Indonesian bank up to 18 months. Foreign banks are only allowed to take up to 40% stake in any Indonesian banks in their initial bid. Thus, this is sending out mixed signals to foreign investors who are willing to invest into the Indonesian financial sector.
Deteriorating Economy
As of late, the Indonesian economy has been exhibiting various negative developments in many of its economic indicators. Some of them include classic textbook symptoms of balance of payment crisis such as a depreciating currency, negative current account and high external debt. I present to you the summary of the Balance of Payment of the Indonesian economy as derived from Bank Indonesia.
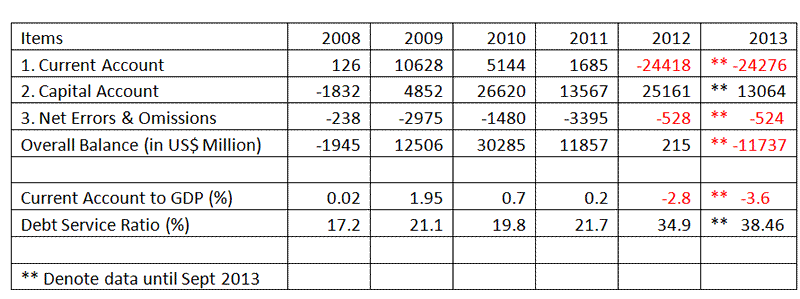
Source : Bank Indonesia
Negative Current Account
As noted above, Indonesia’s Current Account in 2013 has run into negative territory since last year. This can be illustrated by the following graph.
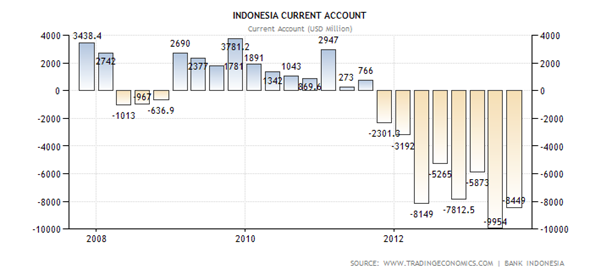
As of September 2013, the average first 9 months of the Indonesian Current Account to GDP deficit is 3.6% or an increase of 28.5% from last year’s 2.8%. There are two reasons contributing to this.
First, the deficit has been contributed by the imbalances in the import over exports. Indonesia as with other developing countries depended much of their export earnings on a small number of natural resources such as rubber, minerals, palm oil and etc. Depending too much on natural resources exports poses a risk to macro-economic problem because their prices are very volatile as compared to manufacturing goods. Any drastic shift in prices will affect a country’s real income and its current account. This is because a drop in export prices will cause a slump in the economy and hence a negative current account. Furthermore, a prolong softening of the export prices of commodities will make it impossible for any Government to rebalance its Current Account. It will have to wait till the export prices recovers at a later date.
Second, the Indonesian Current Account deficit is also partly contributed by the failure of the domestic savings to catch up with domestic investment. Another contributing factor is the increase in the Indonesian Government Budget Deficit. These two are related and is best illustrate with the following equation.
CA = (S – I) – (G – T)
Where,
CA = Current Account
S = Domestic Savings
I = Domestic Investment
G = Government Spending
T = Tax collected by Government
The first equation (S – I) represents the net Domestic Investment. The current Indonesian Domestic Savings (S) rate stands at 32 % while the Domestic Investment (I) surged to 36 %. Hence there is a gap between Savings and Investment and the difference had to be borrowed from foreign sources. Thus this helped contribute to the decreasing value of the Capital Account.
The second equation (G – T) is the Government’s budget deficit. When Government spends more than it receives then it will caused a Budget Deficit and vice versa. The Indonesian Government Budget Deficit is due to many factors such as the depreciating Rupiah, rise in the cost of subsidies, lower tax collection and lower exports due to sluggish economic recovery. The increasing budget deficit is best illustrated by the following graph.
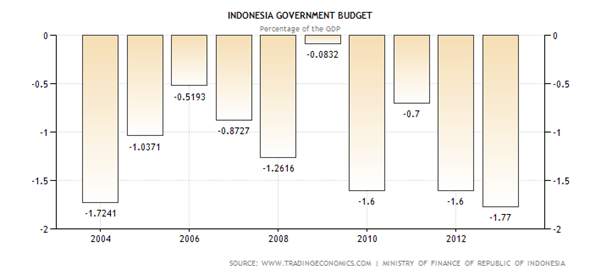
Due to the above factors, the Indonesian Government budget deficit is expected to reach 2.02% to GDP next year.
Depreciating Rupiah
The USD/IDR exchange has declined to new multi-year low or 5 years low and last traded at 12,261 today. The devaluation of the Rupiah has not been engineered deliberately but due to deteriorating economic conditions such as the Current Account deficit, outflow of foreign funds from the equity and debt markets. The Rupiah has depreciated about 20% since the beginning of this year. It is now trading at a multi-year low or 5 year low to be precise. It will soon be testing the five year low of 12,345 which was set in December 2008 as shown below.
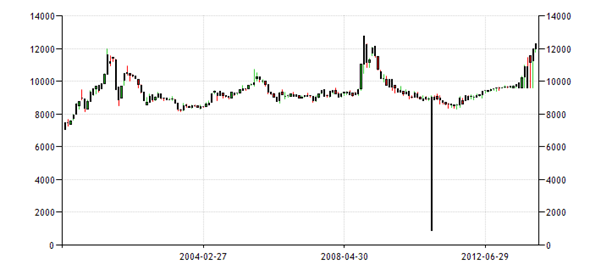
If the Rupiah continues to go down then there is a possibility it will break the 12,345 level. If it does, then there will be a risk of triggering another round of Currency Crisis in Asia.
Spiraling Inflation
Indonesia has been plagued by high inflation since the beginning of this year. The main culprit is the depreciation of the Rupiah by about 20% since the beginning of this year. The depreciation of the Rupiah contributed to the increased cost in subsidized fuel. Below is the inflation chart of Indonesia since 2010.
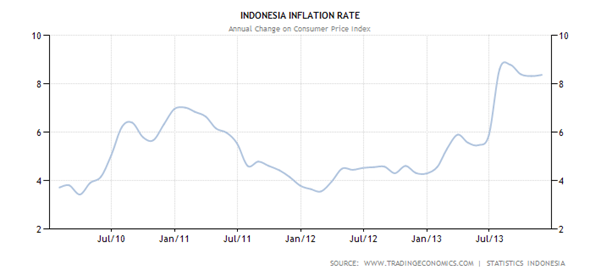
Indonesia’s fuel import is on the rise since 2009. In 2009, fuel import only accounted for US$ 14.81 billion but has since risen to US$ 41.52 or almost 200%. The almost 20% depreciation of the Rupiah has really taken a toll on the prices of goods and services and hence the livelihood of the ordinary Indonesians. Below is the chart on the expenditure on Indonesia’s fuel import as from 2008.
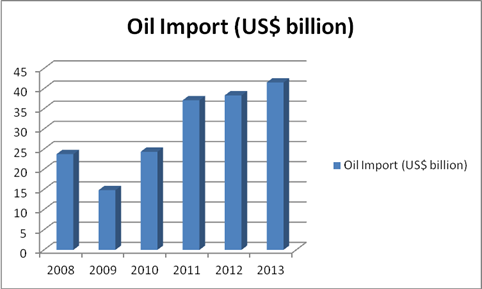
Source : Bank Indonesia
Interest Rates
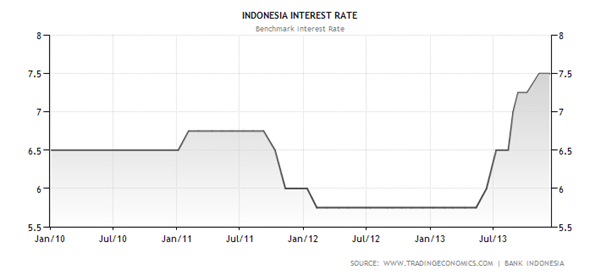
Capital flight from Asia has been heightened during the second half of 2013. Countries like India, Indonesia and Malaysia are particularly badly hit. To prevent further deterioration of the Rupiah, the Indonesian Government hiked its interest rate to 7.5% from 5.75% earlier this year. By increasing the interest rate the Indonesian Government hoped it will prevent further capital flight.
Hiking interest rates will have both cause and effect. The cause as already mentioned above but the effect will have long lasting effect on the economy. No country can withstand prolong interest rate hike. The increase cost on serving the loans from mortgage to margin accounts in the stock market will be felt. Needless to say such an increase will have a dampening effect on the economy, stock and property market.
External Debt
As noted above, the Gross Domestic Savings (32% to GDP) lagged Gross Domestic Investment (36% to GDP). To make up the difference, private firms had to borrow from external sources. Hence, this led to an explosion of the total external debt as shown below.
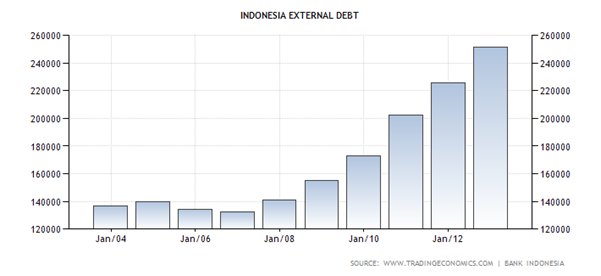
Total External Debt in Indonesia increased to US$ 254 billion in 2012 from US$ 224 billion in 2011. Although the External Debt to GDP is at 30%, low as compared to about 175% in 1998, but we must remember that this ratio will double if the USD/IDR halves. As for the record, the Rupiah has already depreciated by about 20% this year. To illustrate this point I will use the following example.
Malaysia as of 2012 with both the private and public sector owes a total an external debt of US$ 87.81 billion. At the prevailing USD/MYR exchange rate of 3.28 it is equivalent to RM 288 billion. What happens when the prevailing exchange rate halves next year?
Or the exchange rate of, USD 1 = RM 3.28 halved to USD 0.50 = RM 3.28
When the USD halved, RM 3.28 will only buy USD 0.50, then obviously we need to double our Ringgit amount in order to pay for the difference. Hence, instead of paying the original RM 288 billion our borrowers will now have to pay an additional RM 288 billion or RM 576 billion in totality.
Anyway the question on how high the External Debt/GDP is required to cause a major downturn in the economy is rather relative. We cannot draw a line to specify at what level the External Debt/GDP can be considered ominous. In1991, when India was hit by a major economic crisis its External Debt/GDP was only at 30%. In a similar vein when Indonesia was hit by the Asian Financial Crisis in 1998, its External Debt/GDP was at 175%.
Another point that needs to be taken into consideration is that most Asian Currencies except the Japanese Yen are classified as ‘MINOR’ Forex Currencies in the foreign exchange market. Minor currencies are thinly traded or illiquid unlike the ‘MAJOR’ Forex Currencies and hence manipulation is much easier. This explains why the Baht, Won, Ringgit and Rupiah fell precipitously during the last Asian financial crisis in 1998. Hence, in the event of a capital flight, a rapid depreciation of the Rupiah cannot be ruled out and this will also help destabilize the economies around the region when the Crisis becomes contagious.
High Debt Service Ratio
As a result of its high external debt, Indonesia has been subjected to a very high Debt Service Ratio which is equivalent to about 40% of GDP. The table below shows Indonesia’s Debt Service Ratio as a percentage of GDP.
Year |
Debt Service Ratio (%) |
2008 |
17.2% |
2009 |
21.1% |
2010 |
19.8% |
2011 |
21.7% |
2012 |
34.9% |
*2013 |
38.4% |
Source : Bank Indonesia. * denotes data till the 3rd Quarter of 2013.
As indicated above, Indonesia’s Debt Servicing Ratio/GDP has reached 38.4% in the third quarter of 2013, which is clearly unsustainable. The current depreciation of the Rupiah also meant that more Rupiah will be needed to repay Indonesia’s rising external debt. With the current downward trajectory of the Rupiah, I am not surprise that the Debt Service Ratio will balloon to at least 45% in 2014.
Wrapping Up
Despite having one of the lowest Government Debt/GDP at 24%, Indonesia’s economy is far from out of the woods. In fact its problems are just beginning and I expect the Indonesian economy to further deteriorate in 2014. The Rupiah risk much further devaluation and with Indonesia’s tiny foreign reserves which stands at only US$ 95 billion. The total foreign exchange reserves account for only 10.8% of GDP (US$ 878 billion). From this, I can conclude that the Rupiah will have problem to withstanding another round of capital flight or speculative currency attack.
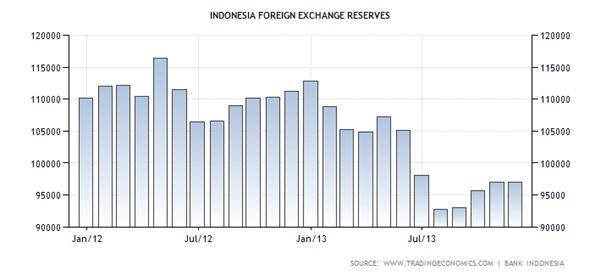
Aggregating all the negative economic indicators, I reckon there is a good chance in 2014, the Indonesian economy might be heading for a perfect storm. What is feared is that the Crisis might spread to other countries in the region that are vulnerable especially India, Malaysia, Thailand, Philippines and others whose economies also displayed imbalances in both the internal and external sectors.
What about Malaysia?
Malaysia is not in a better position either. We too have our own problems like high budget deficits, Government Debt/GDP, Household debts and so on. With the current IMF style austerity measure implemented by our Government, it will definitely have a dampening effect on our economy next year. Implementing contractionary Fiscal and Monetary Policy to straighten our Budget Deficit will not work without any corresponding measures to lighten the burden of the lower and middle income group. Cash handout through the BR1M scheme can be likened to Developed nations giving financial aid to Developing countries. In the end it will create a culture on dependency among the receiving nations.
Facing rising prices in multiple items next year, Malaysian consumers will have a tough time adjusting their budgets. Being rational consumers, they are going to be much more cautious in their spending habits. Hence there will be a tendency to spend less and save more for tomorrow. If this were to go on much longer, there is a risk of our economy being inflicted by the ‘Paradox of Thrift’ disease. Paradox of thrift is a situation where everyone saves more and spends less during times of economic uncertainty. Eventually total consumption will fall and will push the economy further into recession. Thus, increases in savings will do more harm than good to the economy.
On another front, our Ringgit which closes 3.287 to the Dollar today, has been quietly hitting multi year lows as well. Below is the USD/MYR chart.
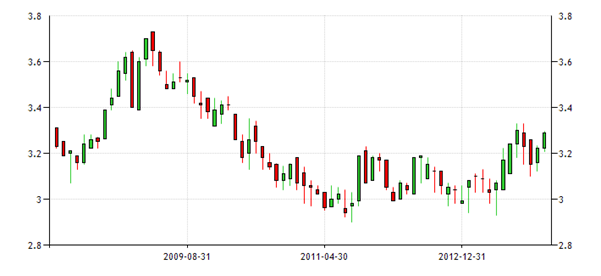
The depreciation of the Ringgit is not good for us as it will make our imports more expensive. Some industries like the semiconductor will be badly hit as many of their components are imported. Imported food and fuel prices will also rise in tandem and collectively will push up the prices of most other things as well due to the passed on inflationary effect.
The problem with our Government and the Indonesian Government as well is that they have been lying on economic numbers such as the inflation and growth rates. This is because all the economic data published are nominal figures meaning it includes the inflation rate. To obtain the real rate of say our household income, we need to divide the figure with the CPI index figure. Recently our Government announced that our average Household income has reached RM 5000 per month or RM 60,000 per year. But this is just the nominal average Household income. To obtain the real Household income we need to divide it with the CPI index figure of 2013 which is estimated to be 107.5.
Hence the following is our real average Household.
Real average Household Income equals,
(RM 60,000/107.5) x 100 = RM 55,813 or RM 4650 per month
Similarly, we can apply the formula to calculate the real figure of all other economic indicators like GDP, GNP and so on.
The recent rise in the Malaysian Stock Market to record highs was used as a smokescreen to divert attention from our economic problems. It is use to fool the people into believing that our economy is growing healthily. However, one of the economic indicators our Government cannot manipulate is the exchange rate. This is because the foreign exchange market is transparent and too big to be manipulated because it trades about US$ 5 trillion a day.
Moreover our economic problems will be further magnified with the coming tapering by the FED which will affect the total Aggregate Demand for Asian exports around the world. Another side effect of the FED tapering will be the rise of interest rates meaning there will be more outflow of capital from emerging markets. Thus this will put more downward pressure on emerging market currencies especially the Ringgit, Rupiah and Rupee. At the same time our local interest rates will be subjected to upward pressure. Hence, this might provide the trigger that will bust our Malaysian and the Indonesian Real Estate market which has reached bubble levels. The following are the charts for the Global real estate prices and by country.
Record High for Global Index
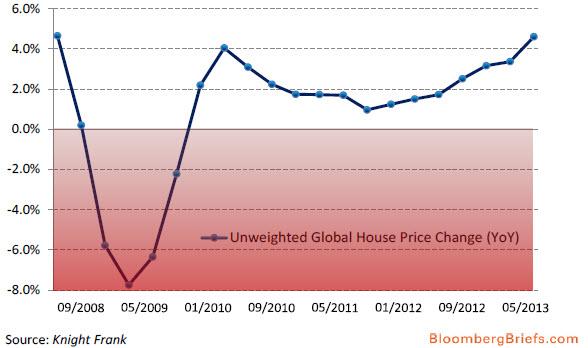
The above chart shows the Global House Price Index. Prices rose at an annual rate of 4.6 % in 2013 as compared to 1.7 % in the same period in 2012. The Knight Frank index incorporates house prices in 53 countries.
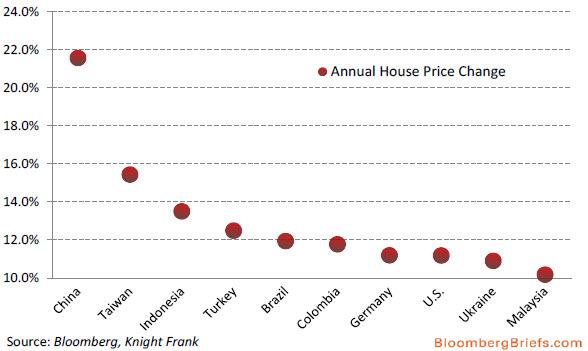
The second chart above shows the annual house price change and China leads with a 21% price rise. Out of the top 10, four are from Asia including Malaysia growing at more than 10%, while our neighbour Indonesia topping 13%. To conclude, despite authorities claimed that our real estate market is still very healthy; the above chart tells a different story.
by Sam Chee Kong
cheekongsam@yahoo.com
© 2013 Copyright Sam Chee Kong - All Rights Reserved
Disclaimer: The above is a matter of opinion provided for general information purposes only and is not intended as investment advice. Information and analysis above are derived from sources and utilising methods believed to be reliable, but we cannot accept responsibility for any losses you may incur as a result of this analysis. Individuals should consult with their personal financial advisors.
© 2005-2022 http://www.MarketOracle.co.uk - The Market Oracle is a FREE Daily Financial Markets Analysis & Forecasting online publication.


