Stock Market Forecast 2014
Stock-Markets / Stocks Bear Market Dec 23, 2013 - 12:38 PM GMTBy: John_Hampson
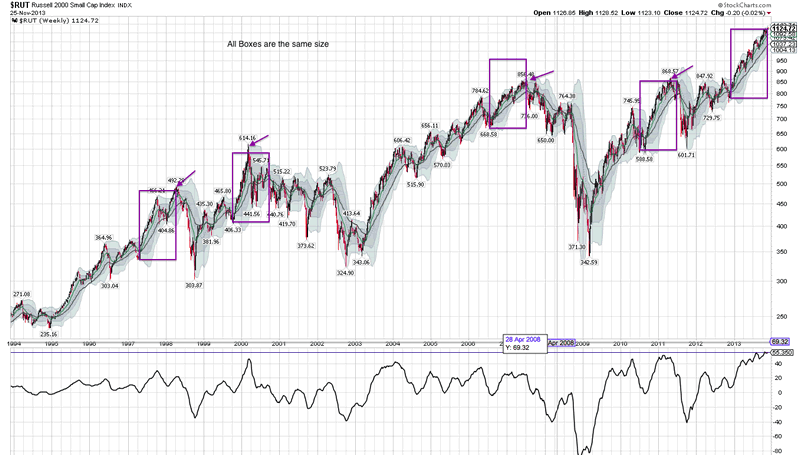
 Dow is up more than 5% five consecutive years now. A sixth such year has not happened before in history. A 5-year bull trend only occurred once before, in the 1990s, and was followed by 3 down years. Russell 2k rallies of similar size and duration to 2013′s (excluding accelerations from major bear lows) are shown below. In each case all the gains were given back the following year.
Source: Fat-Pitch
2014 is the second year in the Presidential cycle, and is the weakest historically by returns, averaging flat. The logic for this is that is it a time for governments to deploy tougher, unpopular policies. The Investors Intelligence bull-bear ratio currently exceeding 40% also forecasts a flat return for the SP500 by the end of 2014, by averaging history, whilst the II bear percentage alone, around 15% the last 4 weeks, has historically produced returns of -5% to -20% over the next 6 months.
The Citigroup Panic/Euphoria Model, having crossed the Euphoria threshold, predicts an 83% chance of losses in 2014. Goldman’s analysis of performance following a year of 25% gains or more point to a median drawdown of 11% in the next 12 months.
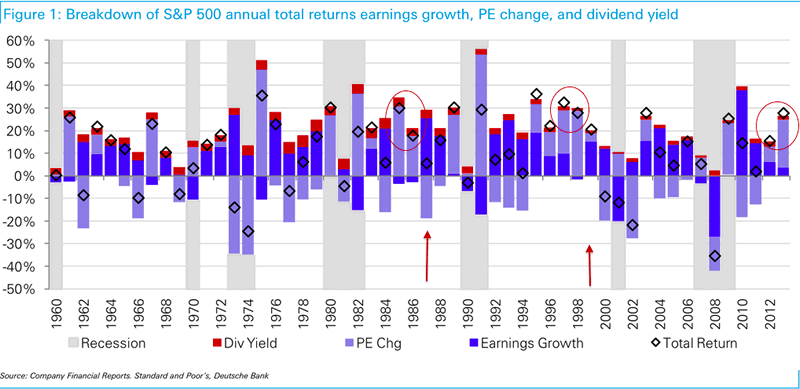
Next is a chart highlighting a couple of previous occurrences similar to 2012 and 2013 where stock index rises were dominated by multiple expansion, not earnings growth.
Source: Fat-Pitch
In both instances the following two years saw better earnings growth. But notably the next two years were 1987, stock market crash, and 1999, at the end of which the Dow peaked, suggesting a common theme of pre-correction exuberance.
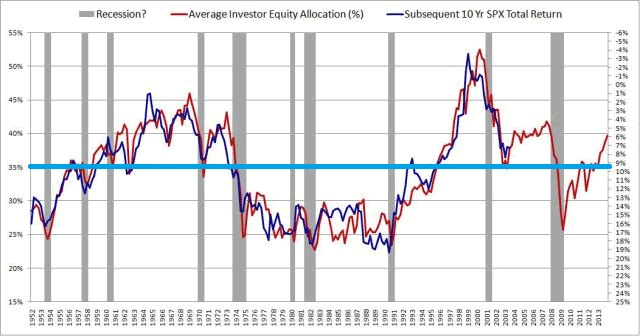
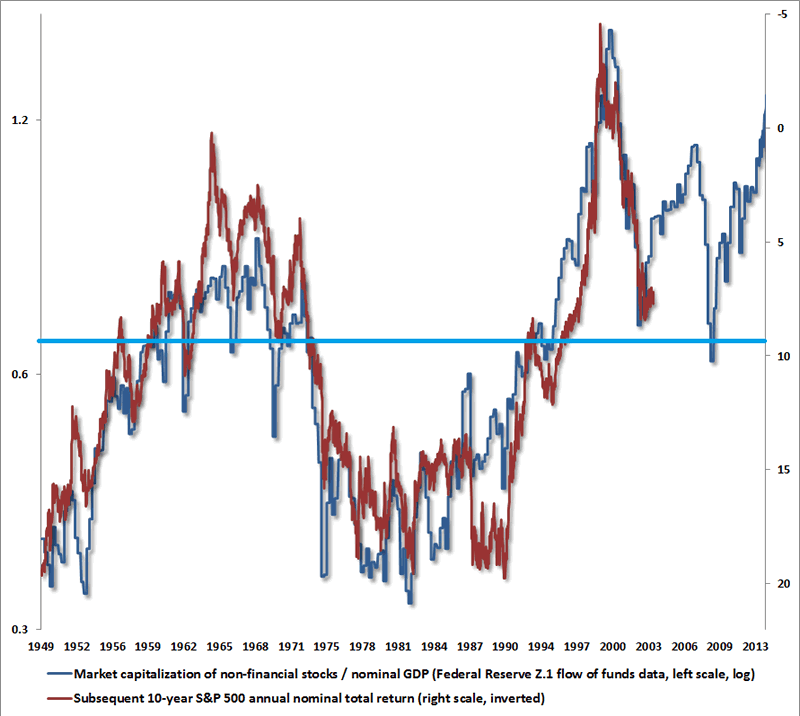
Both the following charts reveal that 10 year stock market returns are closely correlated to deviations from norms 10 years earlier. The first correlates average investor allocations and the second market cap to GDP. I have added the blue horiztonal line averages, revealing both are overvalued currently, but one more extreme than the other.
Source: Philosophical Economics
Source: Hussman
The logic behind both is that mean reversion always occurs. The bigger the deviation build the bigger the subsequent normalisation, as ‘this time is different’ each time is disproven. For US markets currently, we see the second highest market cap to GDP valuation outside of 2000, the 4th highest Q ratio valuation and 4th highest CAPE valuation in history. In all the other such historic outliers, a bear market followed to correct the extreme, there was no orderly consolidation of prices whilst the underlying fundamentals accelerated to catch up. ‘This time is different’ thinking argues that because the Fed has suppressed cash and bond yields, equities have to be revalued higher, so this valuation outlier doesn’t count, and there will be an orderly normalisation of valuation as earnings and GDP will accelerate and yields rise slowly, without any crash in equities.
Interesting to discover that the rally in the 1990s was also at the time considered to be Fed-induced and prolonged. Also interesting to find out that the rally in 1980s, where price also accelerated beyond earnings, was achieved in the opposite environment to today where bond yields were record high and twice as high as equity yields at the time. So for no risk, investors could choose bonds at twice the yield, but still went big into equities as they were at historically cheap valuations and were bought up to mean reversion. Today, investors can choose equities at higher yield than bonds, but equities are conversely at historically expensive valuations. No ‘revaluation’ was required in the 80s, so maybe none is required today and equities will be sold down to mean reversion.
Spikes in margin debt and net investor credit balances to extremes have never previously been resolved in an orderly manner, always leading to bear markets or sharp corrections (as in 2011).
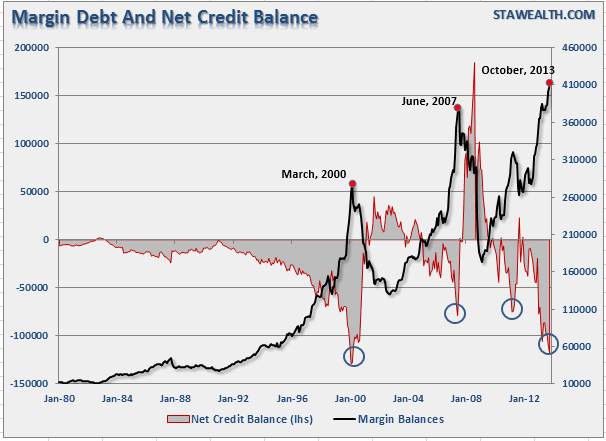
Source: STA Wealth
If ‘this time is different’ we would need to see an orderly reduction in leverage whilst lots of new buyers come to market. But recall through demographics, net investor populations are shrinking across USA, Europe and China, and this is reflected in declining trading volumes.
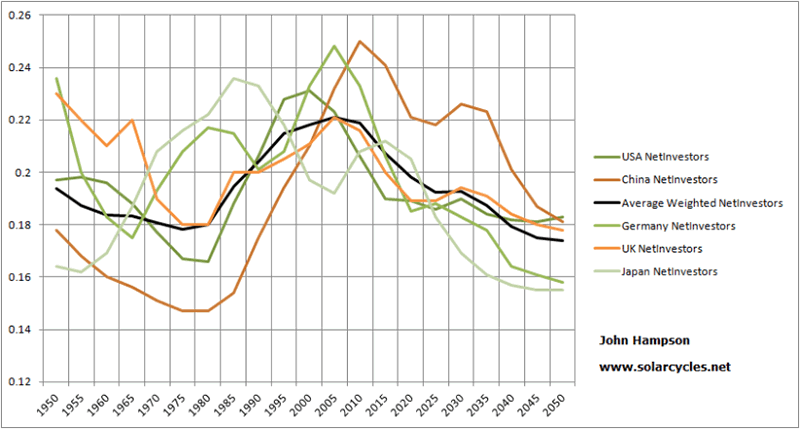
We therefore have a gradually thinning investor population, which adds weight to the likelihood of the current leverage excess spike being resolved in the usual historic manner, namely a deep correction or bear market.
However, in the near term, we could yet see more equities allocation and potentially even more leverage. How much higher could equities run before a bear market or a proper correction erupts? I say proper correction, because none of the pullbacks in 2013 have displayed the usual correction characteristics in terms of depth, duration, and flush-out or spike in breadth and vix. They have been shallow pullbacks, with keen buy-up. To this prolonged lack of correction we can add the deviation in distance above the 200MA of the major indices, the excessive bullish sentiment and the current divergences in breadth, and history is fairly compelling in suggesting high risk of a sharp correction. But again, the question is when, and from how much higher?
The 2007 top in US equities was marked by a steeper ascent in the last 12 months of the bull, but this is beaten in steepness by 2013′s rally. In fact, stocks have moved into a parabolic pattern:
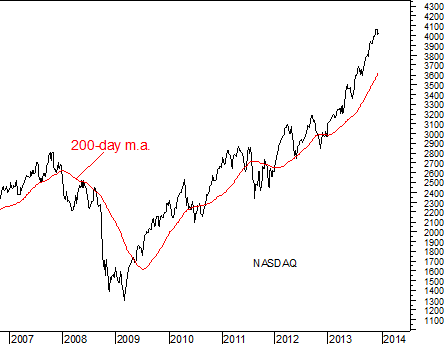
Source: Sy Harding
Parabolic rises are typically resolved in a crash of similar steepness and depth. Comparisons to 1929 are valid if we consider the parabolic ascent, exuberance extremes in valuations, leverage and debt extremes, and a ‘this time is different’ mantra. Where 1929 differs is that it was the culmination of an economic boom with a demographic dividend. The current episode is neither.
History suggests a combination of internals degradation, buyer exhaustion and one or more ‘triggers’ are the likely terminators of a parabolic bull. We see breath divergence, but this should yet degrade further. In a normal topping process, there would be thinnest participation at the final push, but if this is a parabolic top, then we should see increasing divergence as we move higher. There is evidence of buyer exhaustion in sentiment and leverage extremes. We lack the trigger or triggers for the shift in perception. One potential trigger is the earnings season in January, as negative guidance is at a record extreme. A second is that the boost in GDP due to inventory build is likely to be reversed ahead as inventories give-then-take. A third potential trigger is if we see evidence that the current pick up in growth turns out to be a peak in growth rather than a new dawn.
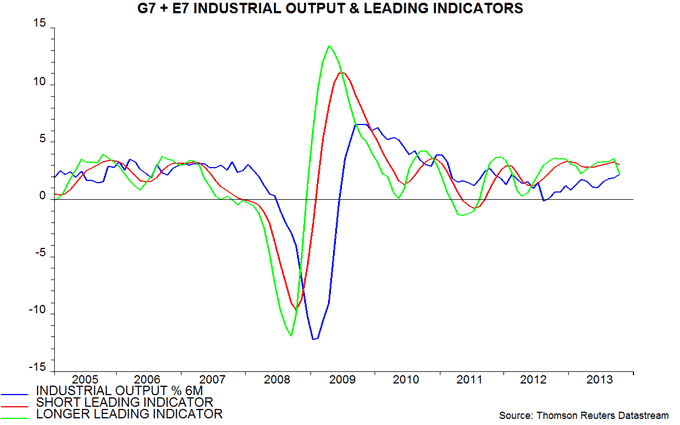
Source: Moneymovesmarkets
The above chart is derived from OECD’s leading indicators and predicts a peak in industrial output between Dec and Feb.
The case that we are in a new secular bull market for equities relies on growth picking up in a meaningful way from here. For forward earnings calculations to be valid, GDP next year would have to average over 3% for the year and earnings growth come in around 10%. If global growth were to pick up, then we would likely see relative outperformance in emerging market equities and in commodities relative to developed market equities, as both are at relative cheapness to the latter and both are beneficiaries of a growth theme.
However, the history of demographics suggest a sustaining economic revival is unlikely to occur in the foreseeable future. Collective demographic trends in USA, Europe, other developed countries (aside Japan) and China are now both recessionary and deflationary, and we can see that in evidence below:
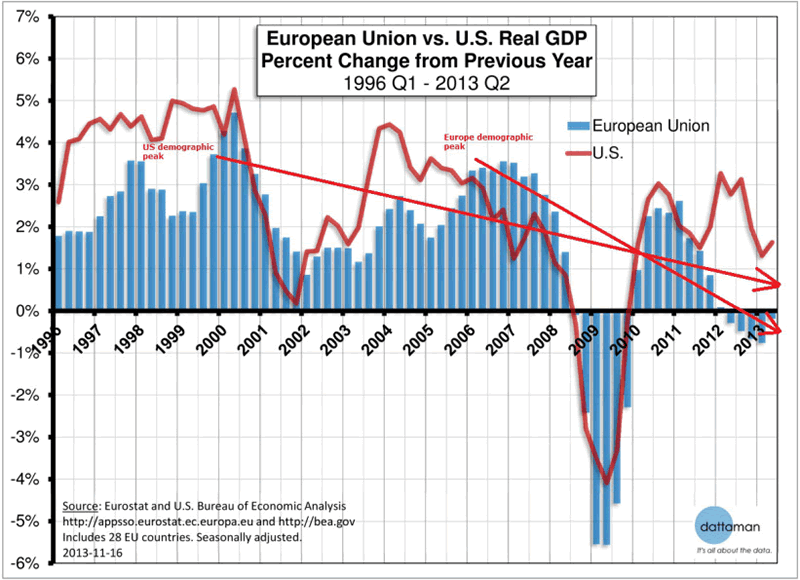
Source: dattaman
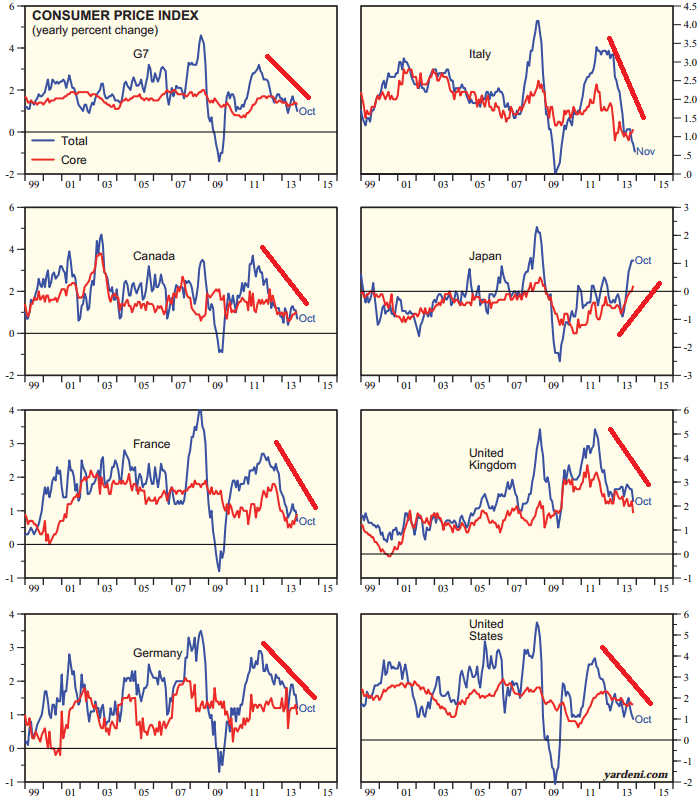
Source: Yardeni
The only G7 country in a positive inflationary trend is the only G7 country in a curent demographic tailwind window: Japan.
The demographic trends are pretty fixed on a medium term view, and historic evidence suggests that government / central bank intervention cannot force people to borrow or spend. Hence we see continued weakness in bank lending in Europe and the US, and real final sales of domestic product at previous recessionary levels.
5 years after the financial crisis, ZIRP is still in place across most of the developed world, and large QE programmes are still required in USA, UK and Japan. The global economy is fragile, and this puts it risk of rising bond yields and/or commodity price increases snuffing out any pick up in growth, as the former two tend to accompany the latter. The US cannot afford bond yields to rise much further because it would have a detrimental effect on interest sensitive sectors such as housing and autos (and also because of the servicing costs of its ballooning debt), whilst rising commodity prices, particularly energies, are input cost drags on all sectors.
To sum up, from a pure statistical perspective, removing any notion of the bigger picture, the probability for 2014 is at best a flat year for equities with a significant drawdown on the way, and at worst a significant down year. Stats are just a guide, but we see united predictions across a range of measures, drawn together at the top of the page.
However, when we look at similar episodes of stock market rises without earnings growth, similar outliers in stock market valuations to now (market cap to GDP, Q ratio, CAPE), similar historic spikes and extremes in margin debt, and similar extremes in bullish sentiment or euphoria as are currently in place, the same mirrors from history keep cropping up: 1929, 1987, 2000, 2007. Together, these signals point to something more historic and devastating at hand, and the ‘fundamentals’ for that occurring are provided by demographics. Yet the bullish momentum of the market and ‘this time is different’ thinking (Fed trumps all, equities need revaluing due to suppressed bonds and cash yields) are making for widespread complacency about (and dismissal of) the parallels.
Whilst we should not overly rely on any one indicator or discipline, it’s the collective case that gives me such conviction on the short side (disclosure: short stock indices). Now do me a favour and give me a convincing case below for why equities will rise in 2014.
John Hampson, UK / Self-taught global macro trader since 2004
www.solarcycles.net (formerly Amalgamator.co.uk) / Predicting The Financial Markets With The Sun
© 2012 Copyright John Hampson - All Rights Reserved Disclaimer: The above is a matter of opinion provided for general information purposes only and is not intended as investment advice. Information and analysis above are derived from sources and utilising methods believed to be reliable, but we cannot accept responsibility for any losses you may incur as a result of this analysis. Individuals should consult with their personal financial advisors.
© 2005-2022 http://www.MarketOracle.co.uk - The Market Oracle is a FREE Daily Financial Markets Analysis & Forecasting online publication.


