Fiat Money Quantity and it's Increasingly Likely Hyperinflation
Economics / Money Supply Dec 20, 2013 - 05:49 PM GMTBy: Alasdair_Macleod
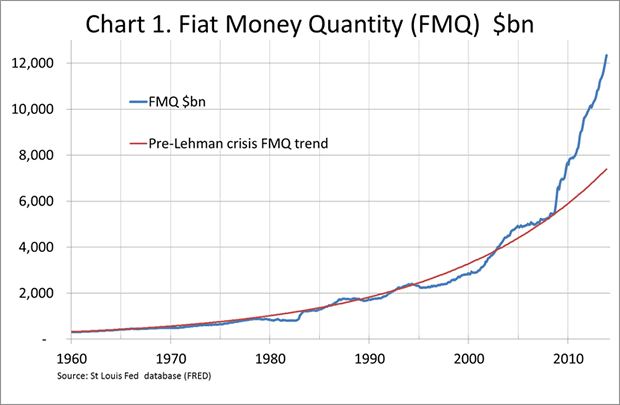
 By November, the most recent month for which statistics are available, the US Fiat Money Quantity (FMQ) had grown to $12.351 trillion. This is $4.96 trillion more than it would be if it had grown in line with the established average monthly growth rate from 1960 to the month before the Lehman Crisis. By this measure monetary inflation since August 2009 is now 67% above trend. This is illustrated in Chart 1 below.

Since the beginning of the year quantitative easing (QE) of $85bn has been driving the increase in FMQ every month, at double the rate of the increase in bank reserves held at the Fed with respect to purchases of Treasuries from the primary dealers. This is because the Fed buys them from primary dealers, crediting their banks with reserves on its own balance sheet, and the primary dealers are in turn credited with deposits at their banks. Alternatively when the Fed buys mortgage assets this can be also regarded as creating deposits at both the Fed and at the banks, though there may be some timing differences involved when banks sell their own assets to the Fed.
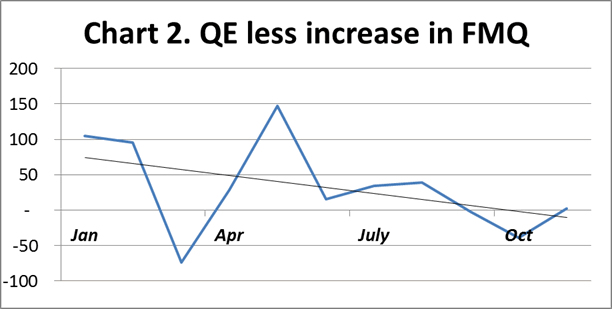
The approximate effect is therefore captured by taking twice the increase in reserves on the Fed's balance sheet, and then subtracting the increase in FMQ, so we can estimate how dependent we have become on QE. The result is shown in Chart 2.

At the beginning of 2013 QE was significantly greater than required by the banking system. With the exception of the March aberration shown on the chart, this amounts to a Fed policy of injecting more fiat money into the economy than the economy actually needed, which is consistent with the Fed's objective to kick-start the economy. Gradually however the financial system has become increasingly reliant on QE with all of it now required by the financial system. This is reflected in the linear trend line on the chart which has now moved into negative territory.
Put another way, all the excess liquidity injected by the Fed through QE is now being used up in the banking system and has now become fully dependent on QE. Therefore, the $10bn reduction in QE announced in December's FOMC minutes, in the absence of other liquidity provided by the Fed, can be expected to put pressure on overnight rates to rise. Until there is an expansion of bank credit consistent with an economy that is definitely expanding, the Fed may be forced to increase QE again, or to take other measures in order to keep interest rates at close to zero.
Gold
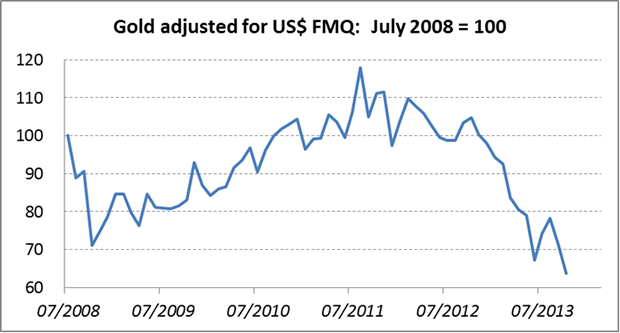
The third chart shows the price of gold adjusted for the increases in FMQ and above-ground stocks of gold since July 2008, the month before the Lehman crisis.

In these adjusted terms gold at $1200 nominal is now trading at 64% of its price in July 2008. At that time systemic risk was not fully understood by investors, and FMQ has since hyper-inflated. If gold returned to the same valuation today as before the Lehman crisis, it would be priced at $1883, without any premium for systemic risk or the increased possibility of a dollar currency collapse, the increasingly likely result of FMQ's post-Lehman hyper-inflation.
Alasdair Macleod
Head of research, GoldMoney
Alasdair.Macleod@GoldMoney.com
Alasdair Macleod runs FinanceAndEconomics.org, a website dedicated to sound money and demystifying finance and economics. Alasdair has a background as a stockbroker, banker and economist. He is also a contributor to GoldMoney - The best way to buy gold online.
© 2013 Copyright Alasdair Macleod - All Rights Reserved
Disclaimer: The above is a matter of opinion provided for general information purposes only and is not intended as investment advice. Information and analysis above are derived from sources and utilising methods believed to be reliable, but we cannot accept responsibility for any losses you may incur as a result of this analysis. Individuals should consult with their personal financial advisors.
Alasdair Macleod Archive |
© 2005-2022 http://www.MarketOracle.co.uk - The Market Oracle is a FREE Daily Financial Markets Analysis & Forecasting online publication.


