Forget the Credit Crisis Headlines, Listen to the Bond Market!
Interest-Rates / US Bonds Apr 16, 2008 - 03:09 AM GMTBy: Clif_Droke
 Let's turn our attention to something that isn't often discussed, namely bonds.
I know what some of you are saying already: “But bonds are boring!” Yes, they may well be boring in most instances. But this isn't one of those times. Actually, the message of the bond market is one of the more exciting and optimistic messages being sent anywhere in the financial markets right now and it behooves us to pay close attention to what bonds are saying.
The collective message of the bond market is one that is being almost entirely ignored by the financial press. While millions of investors are caught up in the past, cowering under their beds waiting for the next financial bomb to drop, the bond market is screaming to all that will listen, “The worst is over – the economy will improve!”
To show you what the bond market is saying, let's look at some revealing charts. To start with, here is the chart of the LIBOR rate for the first three months of 2008.
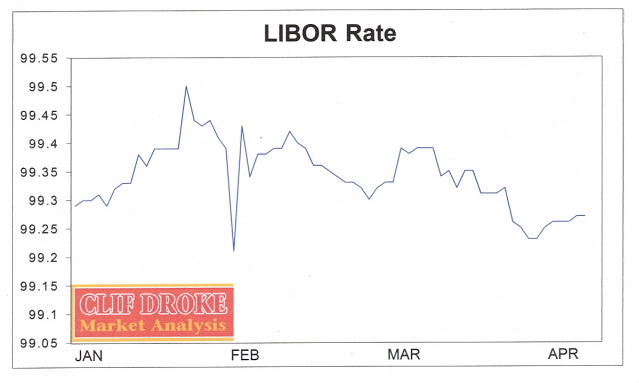
The LIBOR, the London Interbank Offered Rate, is the most active interest rate market in the world and is among the most common of benchmark interest rate indexes used to make adjustments to adjustable rate mortgages. As such, it can be used to measure levels of fear among lenders related to the subprime fiasco.
The LIBOR rate premium over the T-bill rate has been declining sharply ever since peaking out back in mid-January. When the Libor rate goes up sharply it reflects the intense fear of British bankers over financial and economic conditions, just as it did during the January panic. But notice the Libor rate has been coming down conspicuously ever since then and has not approached the high levels of fear of over two months ago. The public remains afraid, yet the monetary powers are clearly not as worried over the state of U.S. financial affairs as they were earlier this year.
Noted economist Ed Yardeni noted back in February that , “ARM resets are less threatening partly because of the Hope Now Alliance (a.k.a., the ‘teaser freezer'), but mostly because the Fed has lowered the federal funds rate by 225bps since last September to 3%. Home mortgage refinancing activity is rebounding. The big banks raised lots of capital to offset their losses last year. The money markets (especially Libor and commercial paper) seem to have calmed down.”
Next we turn to the Treasury yield curve. The Treasury yield curve is calculated by dividing the 10-year Treasury yield into the 3-month T-bill. On a very basic level tells you gross profit margins of financial institutions. They borrow short-term money and loan it out at long-term yields.
As Don Hays recently pointed out, “For the last year, institutions had no way to make money. They squeezed earnings by squeezing home owners that could not afford the homes they were buying. Now, the opportunity to make money is back with the 10-year Treasury [more than] 50% higher than the 90-day T-bill. The Yield Curve also tells you how much you are being rewarded to take risk. Six months ago, there was no reason to take risk with short-term rates higher than long-term rates. Now, the rewards are becoming greater to take more risk by tying your money up longer.”
There is some lag time between the improving yield curve and economic performance, but probably by mid-summer you'll be seeing some noticeable improvements in the economy. The beautiful performance of the yield curve guarantees that improving liquidity will eventually translate into an improved economic outlook.
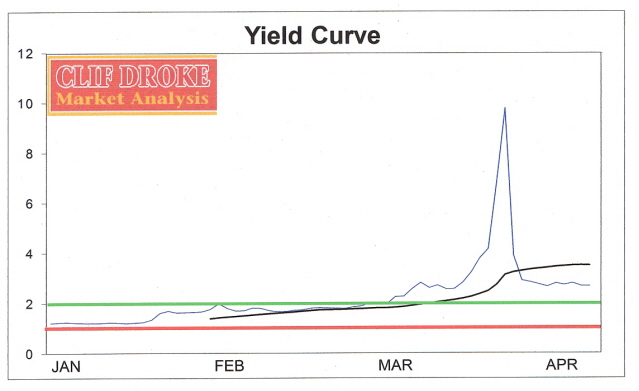
The improvement in the yield curve has been truly head-spinning and incredible. In just a 1-week period in March, the yield curve rose from 2.57 to 9.78! That's the type of improvement you only see about once every ten years. It happens whenever the economy goes down too far and the monetary authorities become panic-stricken about restoring liquidity to the system.
The important 20-day moving average of the yield curve is what's most important to watch. As long as it is giving a reading of 2.0 or higher it shows that the financial system has abundant liquidity to work with and that the economy is almost guaranteed to recover. The online time the 20-day, or 4-week, moving average of the Treasury yield curve went well above 2.0 was in 1992-1993 following the early ‘90s recession (which led to major economic recovery). It happened again in 2002 following the 2000-2001 recession which led to major improvement in the consumer economy.
After peaking in 2003, the yield curve moving average dropped and declined all the way into 2007, which predicted a weak economy. Now that the 4-week moving average of the yield curve has risen to those healthy, bullish levels in reflection of monetary growth again, it's only a matter of time before we all see the improvement in the economy, and by extension, the stock market.
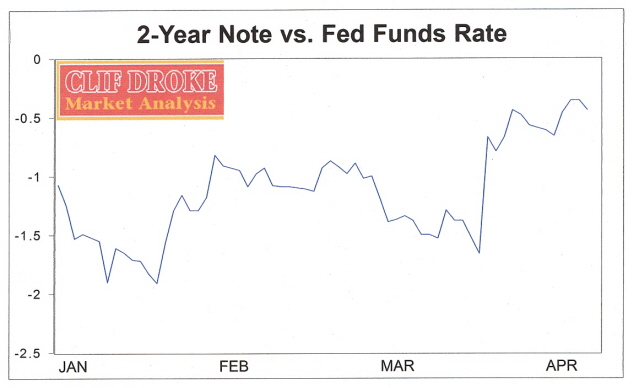
Here's another graph that most investors never look at. It's basically a daily comparison of the 2-year Treasury yield minus the Fed Funds Target Rate. Whenever this graph shows a rising trend, it indicates improving monetary liquidity. Whenever the graph goes above the “zero” line and into positive territory it means that monetary liquidity has been turbo charged and the results will be powerful. The trend has been rising for some time and isn't far from going into positive territory.
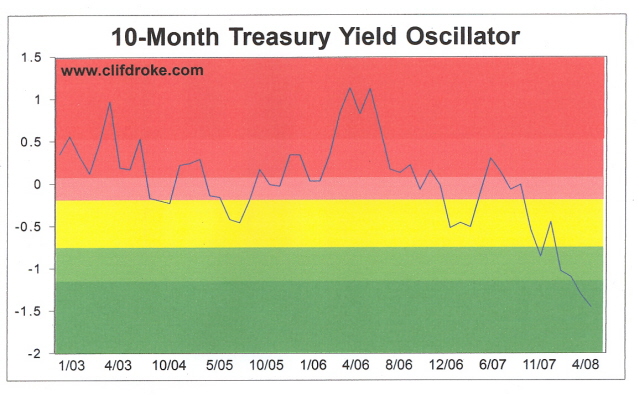
Normally, a falling 10-year Treasury yield would be interpreted as bullish for the stock market. By and large, that hasn't been the case since the 10-year yield started falling steadily last June. This is because the intense fear of the last several months have temporarily overpowered what used to be an inverse relation between bond yields and the stock market. The falling Treasury yield has instead been an indicator of scared investors running to the perceived safety of the bond market.
This time when the yield on the 10-year Treasury starts rising again it will actually be bullish for the economy. Why? Because the higher bond yields go above the Fed Funds Target Rate, the more bullish will be the implication for monetary liquidity. Below is a 10-month price oscillator I keep on the 10-year Treasury Yield Index (TNX). While it can't be used to pinpoint turning points in the bond market, it does provide a general idea that investors should expect a trend reversal at some point in the not-too-distant future. Notice how oversold TNX has become. This suggests a reversal in the downtrend for Treasury yields soon.
The final consideration in the re-liquification process is the daily securities lending volume. The Fed has been loaning securities at a rate not seen in its history. Take a look at the historic lending volumes of just the past days – they are simply through the roof!
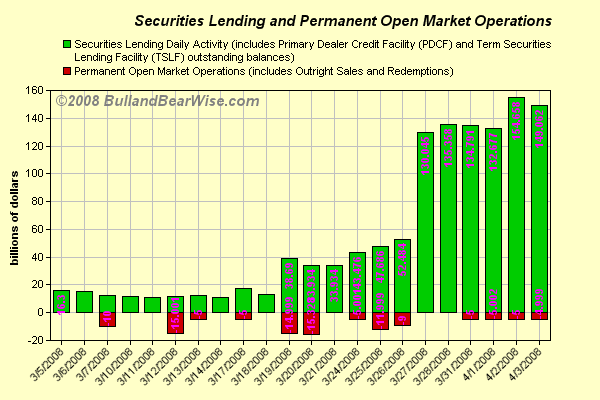
The combined message of this action is that not only is the liquidity crisis a thing of the past, but the widespread fears of further economic deterioration are without foundation. The bond market is saying, “Look forward, not backward. Better times are coming!”
By Clif Droke
www.clifdroke.com
Clif Droke is the editor of the three times weekly Momentum Strategies Report newsletter, published since 1997, which covers U.S. equity markets and various stock sectors, natural resources, money supply and bank credit trends, the dollar and the U.S. economy. The forecasts are made using a unique proprietary blend of analytical methods involving internal momentum and moving average systems, as well as securities lending trends. He is also the author of numerous books, including "How to Read Chart Patterns for Greater Profits." For more information visit www.clifdroke.com
Clif Droke Archive |
© 2005-2022 http://www.MarketOracle.co.uk - The Market Oracle is a FREE Daily Financial Markets Analysis & Forecasting online publication.
Comments
|
lol
25 Oct 08, 18:14 |
Stocks Forecast?
The market knows everything except what's coming, donchya know that? |


