


Stock Market Rally Expanding the Distribution Phase
Stock-Markets / Stock Markets 2013 Dec 09, 2013 - 12:59 PM GMTBy: Andre_Gratian

 Current Position of the Market
SPX: Very Long-term trend - The very-long-term cycles are in their down phases, and if they make their lows when expected (after this bull market is over), there will be another steep decline into late 2014. However, the severe correction of 2007-2009 may have curtailed the full downward pressure potential of the 40-yr and 120-yr cycles.
Intermediate trend - An important top formation is in the making.
Analysis of the short-term trend is done on a daily basis with the help of hourly charts. It is an important adjunct to the analysis of daily and weekly charts which discusses the course of longer market trends.
EXPANDING THE DISTRIBUTION PHASE
Market Overview
A decline which started in earnest last Monday came to a screeching halt on Friday when the jobs report proved to be stronger than expected. What was remarkable about this, is that previously, such a show of economic strength would have caused a sell-off, since it increases the odds of the Fed beginning to taper sooner rather than later. Tapering is now old news and traders have become jaded to its inevitability. We'll have to find something new that will worry the market enough to cause it to sell off!
While the various conditions which suggested that the market should reverse proved correct, the decline fell short of meeting the two conditions required for a protracted correction: breaking below the former short-term low of 1777, and a daily close with about -1800 in the A/D in order to break an important uptrend line. Until these conditions are met, we do not have an intermediate-term reversal.
That does not mean that we go straight up from here! Cycles are still down for the next week or two and a re-test of the low is more than likely. The probability of meeting the above conditions on that pull-back are slim and we can surmise that primary III is still ahead of us (assuming that the labeling is correct). What form it will take is for the market to tell us.
So what comes next? We'll have to wait until after the pull-back to get a count for the next uptrend. It could be fairly shallow because, although we have relieved the short-term pressure, the long-term ones are still there and will need to be addressed sooner or later. Here are recent observations made by the SentimenTrader:
"Traders in the Rydex family of mutual funds have moved to a new level of speculation in the major index funds. With $5.30 riding on bullish funds for every $1.00 of bearish funds, they've never been more exposed."
"Assets in equity mutual funds and ETFs have now eclipsed assets lingering in safe money markets by a ratio of 3.7 to 1, a three-decade record."
"Stocks showed a positive reaction on Friday, ostensibly in response to the Non-farm Payroll report. The move comes on the heels of what has already been extreme sentiment levels."
You tell me! Is that the condition of a market which is ready to move much higher before correcting?
Chart Analysis
The weekly oscillators had turned down during the week, but were rescued by Friday's surge and ended the week only a smidgen lower.
The daily chart (courtesy of QCharts) appears below.
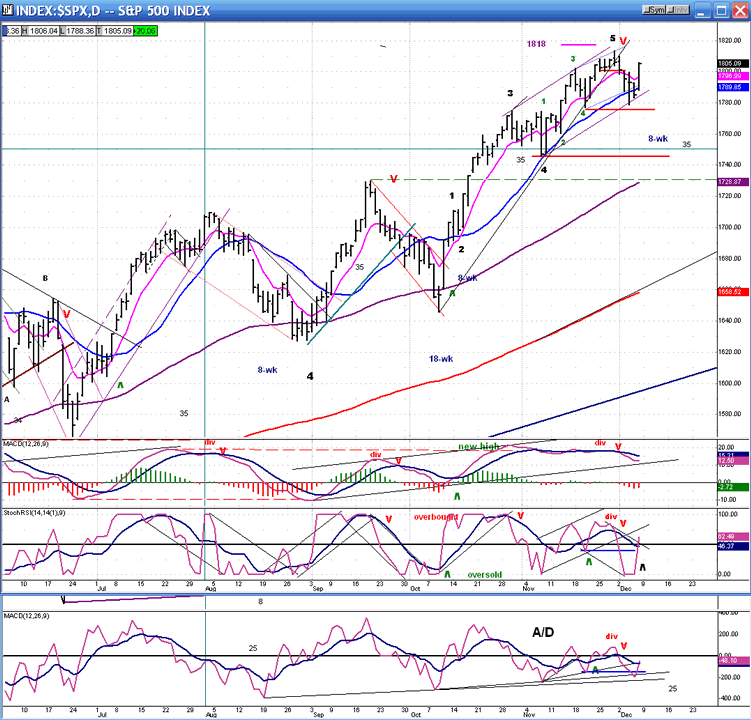
We can see how Friday's strong move recovered most of the previous week's decline, but it stopped short of making a new high. Declining prices had broken a minor support level and come out of a minor up-channel, but stopped at the bottom of the next wider channel, just above the more important support that needed to be broken to start a more severe decline.
As mentioned above, the odds of the bottoming 8-wk cycle carrying enough punch to drive prices below the 1777 level are not very good, but you never know! The market has another week or 10 days to retrace from Friday's high, and this would leave us with the negligible possibility that we have completed the right shoulder of a H&S pattern. Therefore, dropping below 1777 would turn out to be significant. The short-term cycle that is being discussed is not the only cycle affecting the market at this time. There are longer-term cycles also exerting downside pressure that will intensify as we go forward.
In any case, it is clear that the daily oscillators did not generate a buy signal in spite of Friday's strong move up. They ended the day mixed with the MACD positive but declining, the SRSI neutral, and the A/D still negative. We'll see how they perform next week.
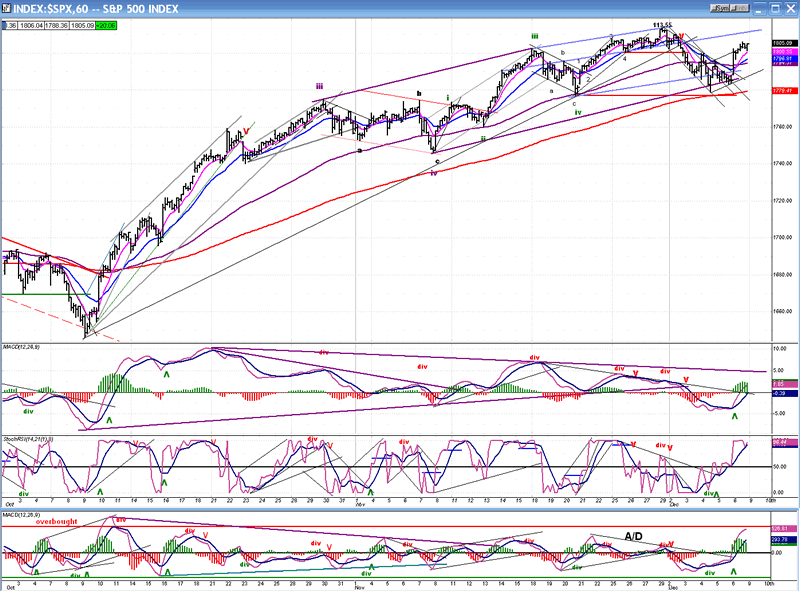
The hourly chart shows the effect of Friday's strength on the hourly oscillators. They ended the day overbought and in a position to roll over. Here, we see more clearly how the index could be in the process of making a right shoulder. To confirm this and taking advantage of the bottoming cycle, it would have to retrace over 28 points and move below the red horizontal line in about a week. Beyond that, we will be entering one of the most bullish periods of the year with the cycle in a new up-phase. It will then be a matter of how much headway SPX can make during the next two or three weeks. By the first or second week in January, with more cycles bottoming in February, there will be another attempt at reversing the trend in a significant way. The weaker the advance, the better the chance the bears will have to inflict some real damage on the bulls.
Cycles
The 8-wk cycle still has another week or ten days left before it gets to the bottom of its phase. That's enough time to affect prices negatively, perhaps in a real way. There are intermediate and long-term cycles which are also exerting downward pressure on the market and can perhaps give it an extra push.
Breadth
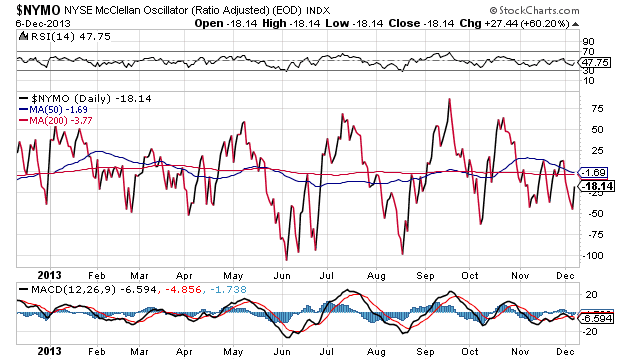
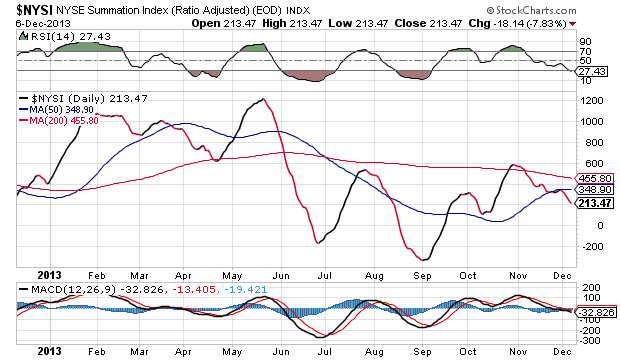
The McClellan Oscillator and Summation Index (courtesy of StockCharts.com) appear below.
During the first few days of November, the McClellan Oscillator went negative and pretty much stayed in the red zone while SPX was tacking on another 60 points to complete the move which started at 1646. That had the effect of driving the Summation Index almost down to the level where it was at the beginning of October -- a level corresponding to the mid-1600s of the SPX.
That kind of relative weakness in breadth is a stern warning that all is not well in the price inner structure, and it should eventually result in more than a 34-point correction.
Sentiment Indicators
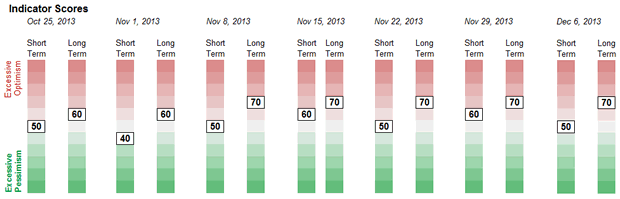
The SentimenTrader (courtesy of same) appears to be establishing a new norm of 70 in its long term indicator. It has closed at that elevated level for five consecutive weeks. Perhaps more importantly, it remained at that level throughout last week's correction.
If, after another week or so of pulling back, that reading remains in place and the market attempts to move higher, there is a good chance that we could even see a higher reading by early January. If that occurs, and if there has been no significant improvement in breadth, the market will become even more vulnerable to an intermediate correction than it was last week.
VIX
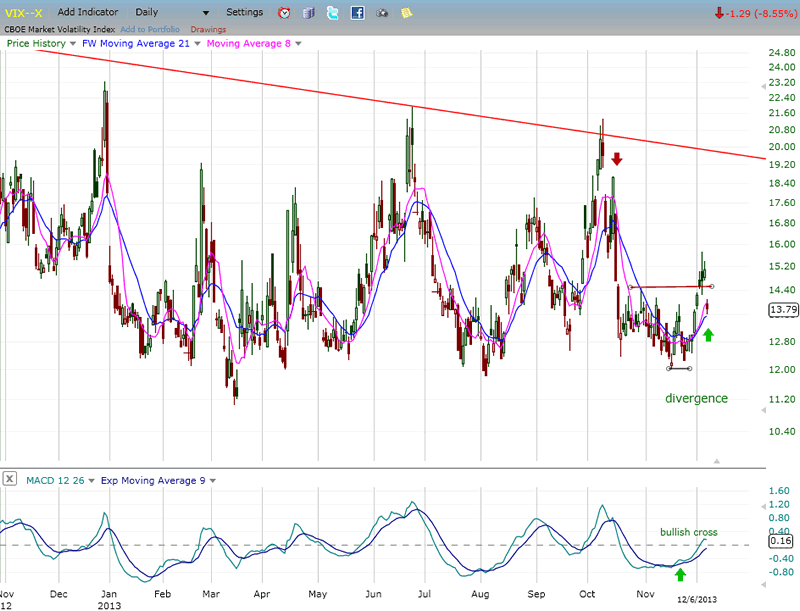
By moving above acluster of former short-term tops, VIX made an attempt at breaking out. However, it was pushed back inside its base by Friday's strong rally and, while it may again come out of it on next week's expected market pull-back, it is unlikely to develop enough momentum to get above its declining long-term trend line. This is what it would take to signal that a major top is in place and it looks as if VIX has a little more work to do before it gets to that stage.
IWM (ETF for Russell 2000)
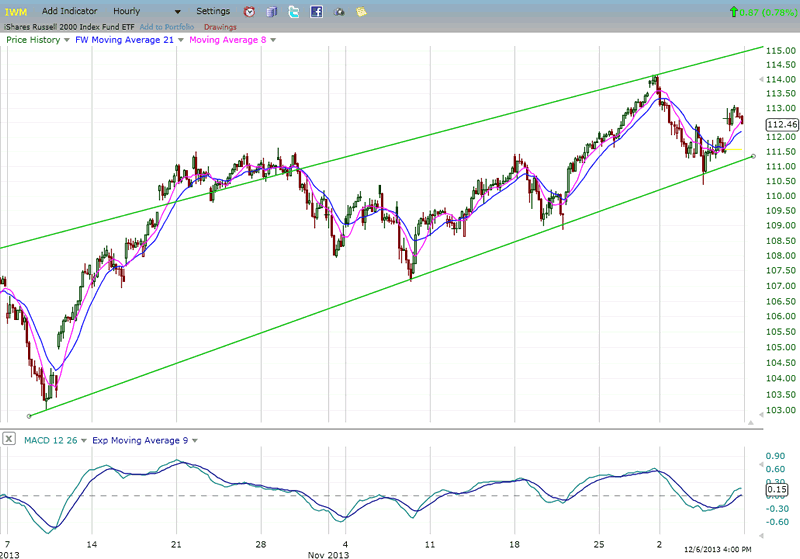
IWM found support on its uptrend line and former short-term peak, telling us that it was not ready to give a sell signal. This coming week, it will have another chance to try again. This may not mean much, but note that Friday, IWM closed a little weaker than SPX. This could give some credibility to another anticipated pull-back.
BONDS
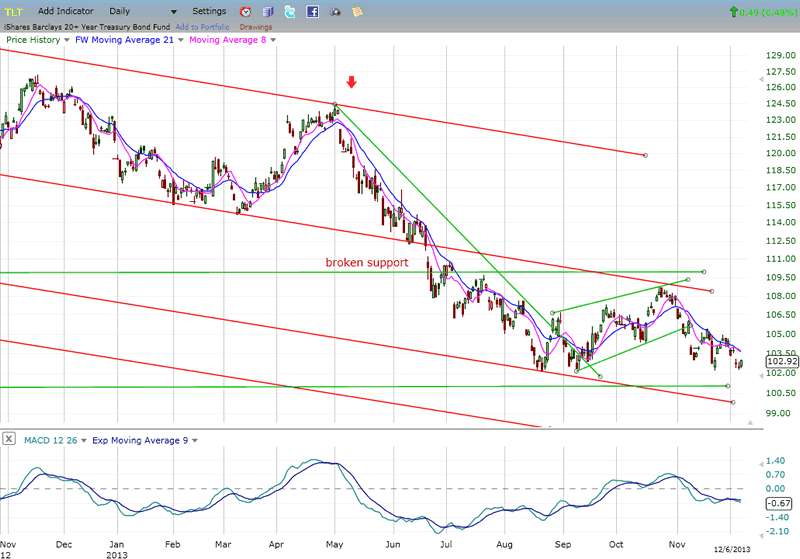
TLT continues to languish at the low point of its long-term correction with little sign that it is about to do anything significant. It appears to have two options: work its way even lower, or continue to create a base from which it will eventually be able to attempt a rally in a downtrend.
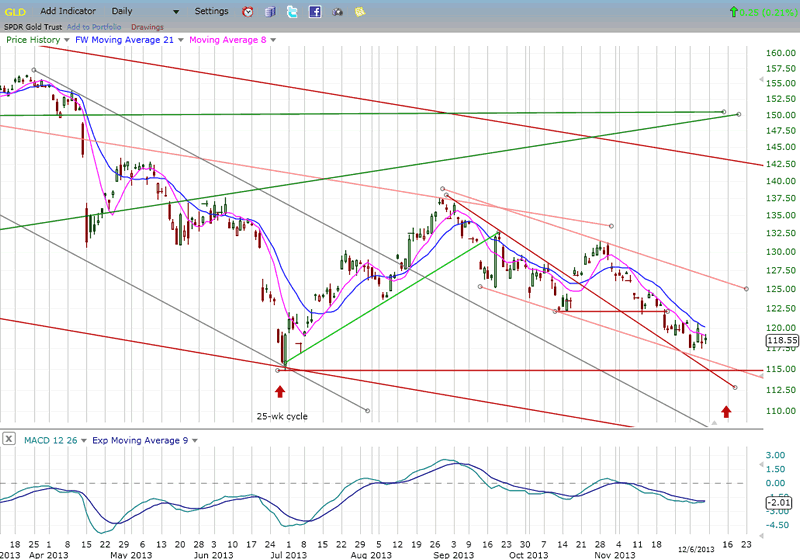
GLD (ETF for gold)
GLD is trying to hold above its former long-term low, but as long as it remains under pressure from its bottoming 25-wk cycle which is due in a week or two (red arrow), the odds continue to favor a continued decline to about the 110 area.
UUP (dollar ETF)
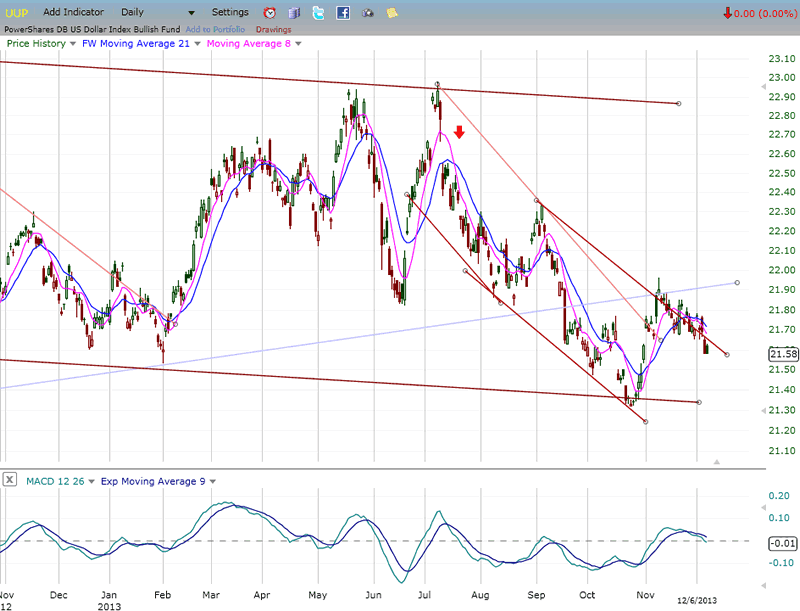
UUP continues to consolidate after its initial break-out. Its lack of positive response to the strong non-farm payrolls report Friday, makes one wonder how ready it is to resume its uptrend. The MACD is about to go negative, which could indicate some additional selling directly ahed. The primary factor behind the dollar's weakness is the Fed's interest rates policy. We may need to see evidence of a change before UUP can regain some upside traction.
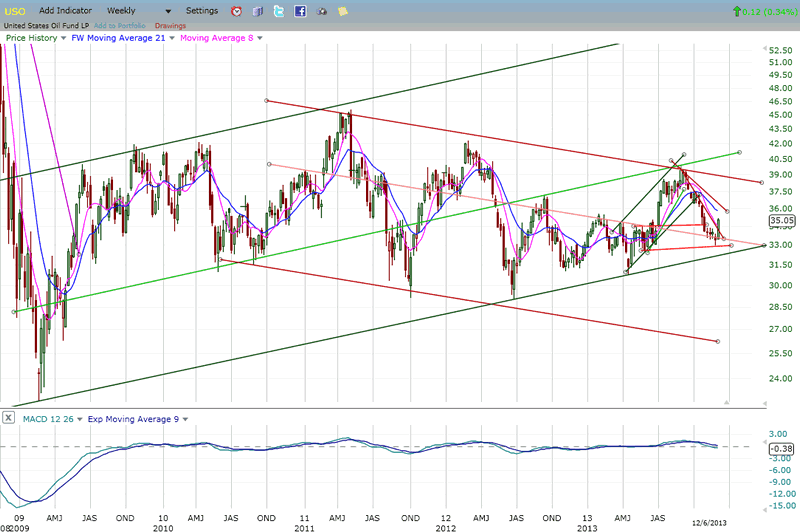
USO (United States Oil Fund)
USO found support near the low of a former congestion level and bounced. It also appears to have completed a 5-wave pattern at 33. If so, it may now have started a corrective wave which, when complete, could lead to new lows.
Looking at the larger structure, it apears that USO's rise to 30.50 was also a corrective wave, and that the index is now in danger of breaking out of the green channel on the downside. Note that its previous rally was stopped by the junction of two resistance lines, confining it to the bottom of its rather tepid bull market channel from the 2009 low. Any serious decline in the stock market - which is only a matter of time - will most likely send it below the rising trend line and cause it to drop to the bottom of the red channel - at a minimum. This is not a chart pattern that is encouraging to the bulls.
Summary
After an initial decline from its 1813 high, SPX found support at the bottom of a channel and at a level just above its 200-hr MA. Friday's jobs report initiated a strong counter-trend rally which could be wave "b" of a corrective pattern. Wave "c" be should be formed as a result of the pressure exerted by the 8-wk cycle which is due to bottom in a week to ten days. This is one potential scenario.
However, if the next pull-back exceeds 1777, a much weaker correction could be in process. Even if the current correction is limited in scope, SPX may find it difficult to make much more upside progress. The negatives pointing to an important top have not gone away and are not likely to be erased by only a short-term pull-back. On the contrary, more upside will only exacerbate them.
FREE TRIAL SUBSCRIPTON
If precision in market timing for all time framesis something that you find important, you should
Consider taking a trial subscription to my service. It is free, and you will have four weeks to evaluate its worth. It embodies many years of research with the eventual goal of understanding as perfectly as possible how the market functions. I believe that I have achieved this goal.
For a FREE 4-week trial, Send an email to: ajg@cybertrails.com
For further subscription options, payment plans, and for important general information, I encourage
you to visit my website at www.marketurningpoints.com. It contains summaries of my background, my
investment and trading strategies, and my unique method of intra-day communication with
subscribers. I have also started an archive of former newsletters so that you can not only evaluate past performance, but also be aware of the increasing accuracy of forecasts.
Disclaimer - The above comments about the financial markets are based purely on what I consider to be sound technical analysis principles uncompromised by fundamental considerations. They represent my own opinion and are not meant to be construed as trading or investment advice, but are offered as an analytical point of view which might be of interest to those who follow stock market cycles and technical analysis.
Andre Gratian Archive |
© 2005-2022 http://www.MarketOracle.co.uk - The Market Oracle is a FREE Daily Financial Markets Analysis & Forecasting online publication.