GOLD Technical Analysis Charts
Commodities / Gold and Silver 2013 Dec 01, 2013 - 04:12 PM GMTBy: Submissions
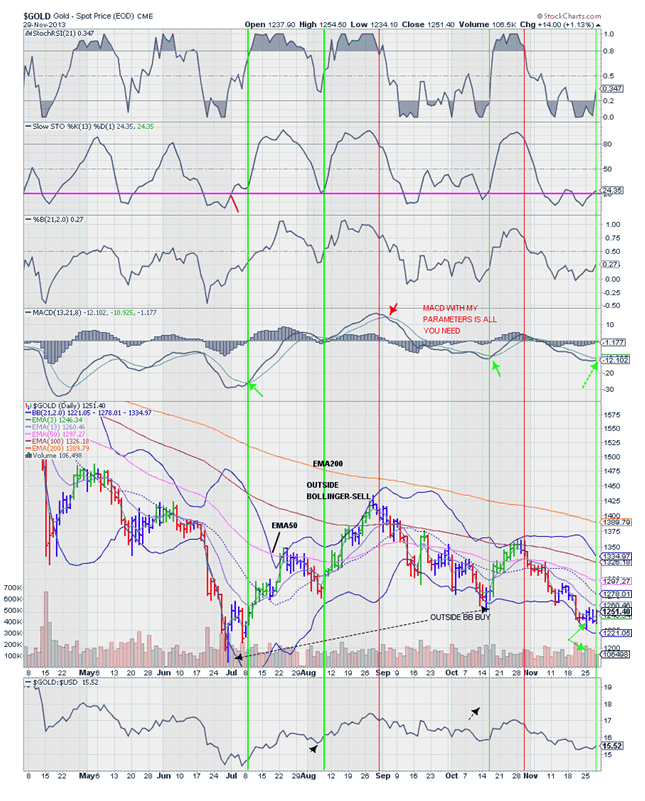
Thomas Clayton writes: I have adjusted the variable parameters to titrate to the best signal .. Cross of stochastic rsi below 0.8 or above 0.2 and, slow stochastics 80 & 20, macd line cross works well on this daily chart. Price outside of bollinger band top or below.. Liquidate long or short positions repectively.
Notice that the macd lines are ready to cross up. Notice cup & handle confirmation at resistance of 1425. Initial resistance at 1300-1325. Gold is still on the defensive, however showing signs of a bottom. Midpoint on indicators determine above mp, uptrend, below mp, downtrend. You may see my work at stockcharts.com, public chart lists, easy money, Clayton Tom.

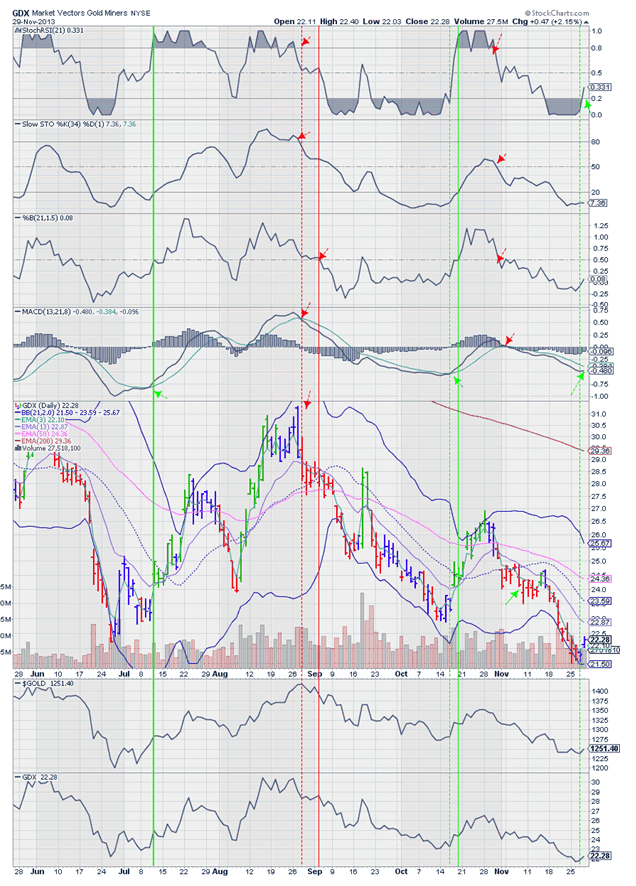
Gdx is the highest volume etf which reflects the gold miners. Gdx is been beat down and bruised and probably has the lowest sctr relative strength. As the adage goes, buy low. Maybe this is the time. The daily chart is ready to pre-empt a buy signal. Notice the the stochastic rsi anticipates the slow stochastic trigger of buyer and sell

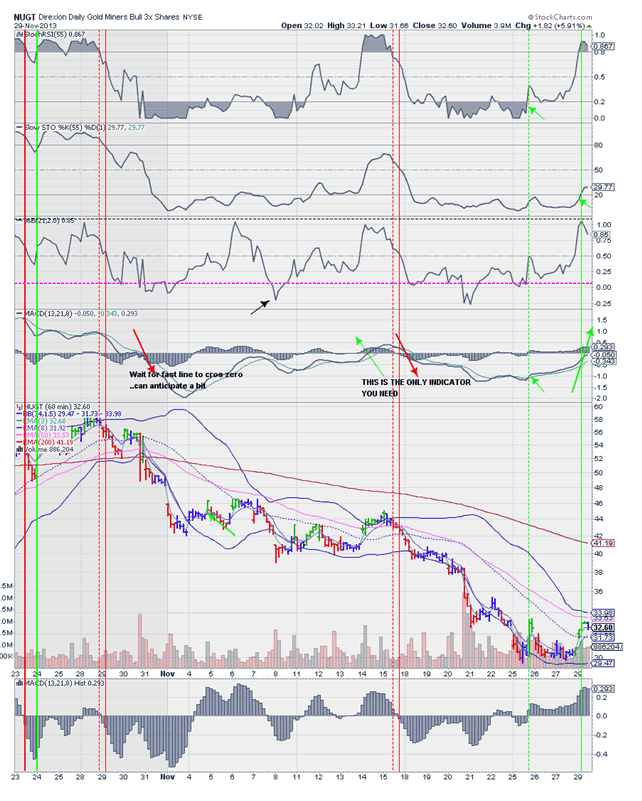
Nugt is the etf 3x gdx. You may use the macd cross at zero only..each time frame is unique .. See the green & red pointers and notice the macd histogram beneath.

By Thomas Clayton
© 2013 Copyright Thomas Clayton - All Rights Reserved
Disclaimer: The above is a matter of opinion provided for general information purposes only and is not intended as investment advice. Information and analysis above are derived from sources and utilising methods believed to be reliable, but we cannot accept responsibility for any losses you may incur as a result of this analysis. Individuals should consult with their personal financial advisors.
© 2005-2022 http://www.MarketOracle.co.uk - The Market Oracle is a FREE Daily Financial Markets Analysis & Forecasting online publication.


