Stock Market Fundamentals Rendered Irrelevant by Fed Actions
Stock-Markets / Stock Markets 2013 Nov 26, 2013 - 05:25 PM GMTBy: J_W_Jones
 The fundamental backdrop behind the ramp higher in equity prices in 2013 is far from inspiring. However, fundamentals do not matter when the Federal Reserve is flooding U.S. financial markets with an ocean of freshly printed fiat dollars.
As we approach the holiday season, retail stores are usually in a position of strength. However, this year holiday sales are expected to be lower than the previous year based on analysts commentary and surveys that have been completed. This holiday season analysts are not expecting strong sales growth. However, in light of all of this U.S. stocks continue to move higher.
Earnings growth, sales growth, or strong management are irrelevant in determining price action in today’s stock market. In fact, the entire business cycle has been replaced with the quantitative easing and a Federal Reserve that is inflating two massive bubbles simultaneously.
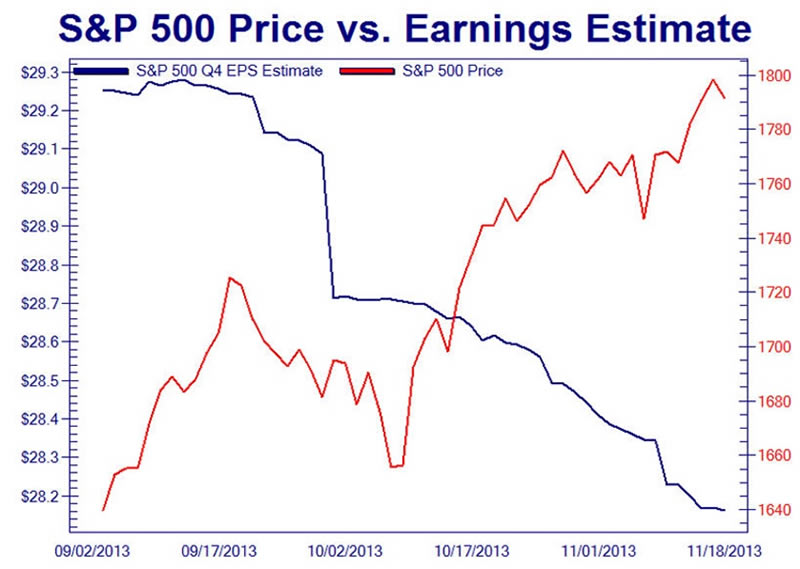
Through artificially low interest rates largely resulting from bond buying, the Federal Reserve has created a bubble in Treasury bonds. In addition to the Treasury bubble, we are seeing wild price action in equity markets as hot money flows seek a higher return. Usually fundamentals such as earnings, earnings estimates, and profitability drive stock prices. However, as can be seen below the U.S. stock market is being driven by something totally different.

Chart Courtesy of www.zerohedge.com
The chart above is beginning to illustrate that fundamentals are becoming irrelevant. The only thing that matters in today’s marketplace is the flow of fresh liquidity out of the Federal Reserve and into the banking system. This process helps to fuel more risk taking and pushes longer-term investors away as hot, speculative money flows into high risk assets.
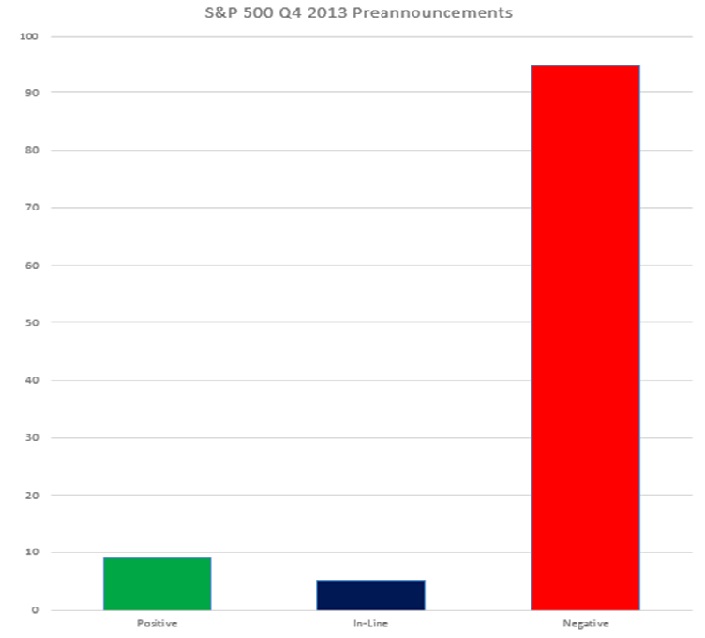
The chart below, which came from Thomson I/B/E/S demonstrates that the future outlook is clearly not any better.

As can be seen above, over 90% of the S&P 500 companies have already reported negative 4th quarter 2013 pre-announcements. Essentially, these companies are warning equity investors that earnings expectations are going to be lower than expected.
Normally this would be seen as a headwind for equity prices particularly because the ratio is the worst on record. However, equity prices have rallied straight through the dismal earnings data.
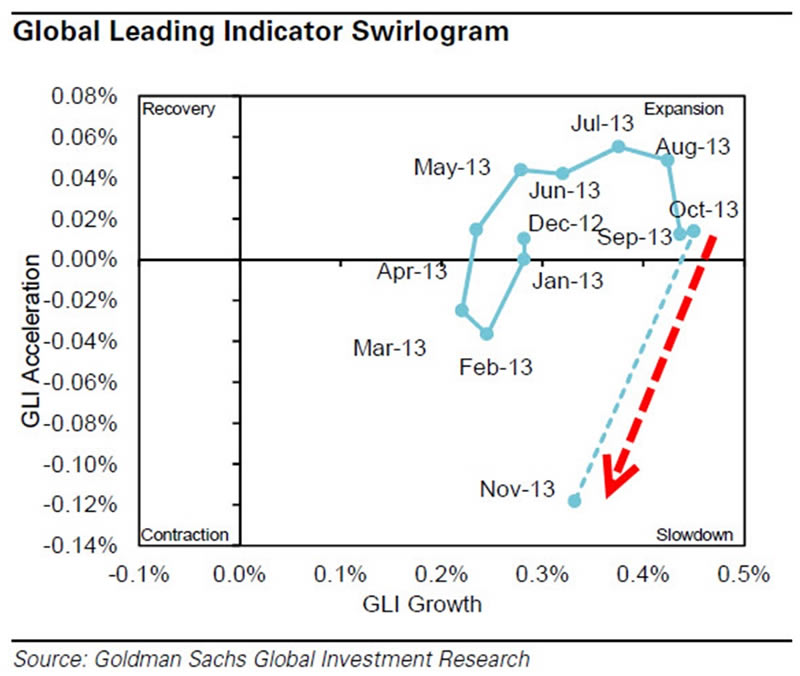
In addition to earnings, global leading indicator analysis from Goldman Sachs is also issuing warning signals. The Global Leading Indicator Swirlogram is showing decisively that global leading indicators are slowing down and are moving toward possible contraction presently.

On top of consistently lowered earnings estimates and forward guidance in S&P 500 companies at the worst levels on record, we are seeing evidence that would suggest the global economy is slowing down. In light of this information, how can risk assets be rallying?
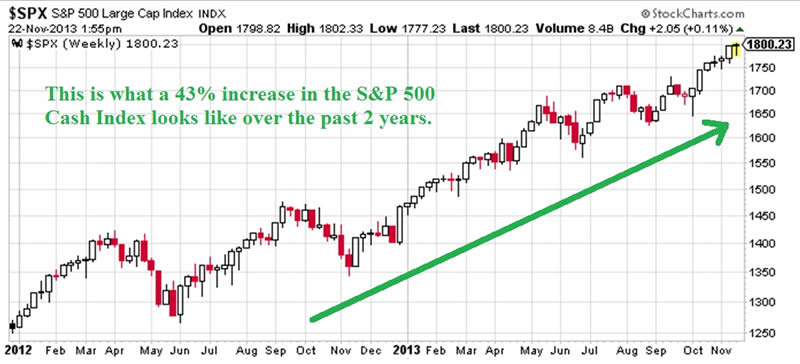
The weekly chart of the S&P 500 Cash Index (SPX) going back to the beginning of 2012 tells a rather compelling story. The S&P 500 Index in that period of time has rallied by more than 43% as shown below.

However, readers should note that the past 6 – 8 weeks have seen prices move higher. In fact, the last time the S&P 500 Index had 7 consecutive weeks of higher prices was back in 2007. In light of the negative fundamental data, this is the price action we are witnessing in real time.
How can anyone realistically purchase risk assets here? I realize that prices could go higher and likely will go higher if the Federal Reserve continues to accommodate the U.S. capital markets.
However, as prices move higher and bears continually get run over at some point a correction or possibly worse could be initiated. Clearly a bubble has formed in Treasuries, but if this type of price action continues a bubble will form in equities as well. Several famous financial pundits are already beginning to discuss this very real possibility.
Financial pundits and asset managers are beginning to come forward to discuss their views that equities are at full value and are forming a possible asset bubble. Famous investors and portfolio managers like Larry Fink and Carl Icahn have stated recently that they believe the U.S. equity market is moving into dangerous territory where large corrections could loom in the future.
Furthermore, in a recent interview with Fox News, renowned economist and political pundit David Stockman made the following statements:
“This is the fourth bubble the Fed has created through easy money and printing press expansion.”
“The Fed has taken itself hostage.”
“This is a destructive poisonous monetary medicine that is being put into the system that is distorting all kinds of economic mechanisms with mal-investments on a massive scale.”
Stockman concludes that “its like 2007 – 2008 all over again.” Whether the bubble exists in the Treasury market or in U.S. equities is hard to say. In fact, we maybe witnessing bubbles in both asset classes and history says the endgame will likely end badly.
I want to be clear that many times bubbles are viewed in hindsight and we may be months or even years from the top. What I do know is that the Federal Reserve has a horrible track record. They have reduced the U.S. Dollar’s purchasing power incredibly since their inception. Additionally they have always reduced economic stimulus too late and inflation has ravaged markets historically.
While I do not know when the bubbles will burst, what is known is that recently the mere mention of a possible tapering of the Fed’s Quantitative Easing program sent U.S. stocks considerably lower.
All eyes are on the Fed and when they finally taper, they will find out that they are trapped. While prices may continue higher for months or years in the future, history suggests the endgame will be ugly for those who chased the speculative bubbles.
In closing, I will leave you with a quote from a recent interview with legendary investor Jim Rogers, “The Fed will self-destruct, before the politicians realize what is going on.”
If you are looking for a mathematical and statistical based approach to trading, OptionsTradingSignals.com may be a perfect fit to improve your option trading results. Give OptionsTradingSignals.com a try today!
J.W. Jones is an independent options trader using multiple forms of analysis to guide his option trading strategies. Jones has an extensive background in portfolio analysis and analytics as well as risk analysis. J.W. strives to reach traders that are missing opportunities trading options and commits to writing content which is not only educational, but entertaining as well. Regular readers will develop the knowledge and skills to trade options competently over time. Jones focuses on writing spreads in situations where risk is clearly defined and high potential returns can be realized.
This article is intended solely for information purposes. The opinions are those of the author only. Please conduct further research and consult your financial advisor before making any investment/trading decision. No responsibility can be accepted for losses that may result as a consequence of trading on the basis of this analysis.
© 2005-2022 http://www.MarketOracle.co.uk - The Market Oracle is a FREE Daily Financial Markets Analysis & Forecasting online publication.


