Apple AAPL Stock Price to Test Key Near-Term Resistance
Companies / Company Chart Analysis Nov 26, 2013 - 05:19 AM GMTBy: Mike_Paulenoff
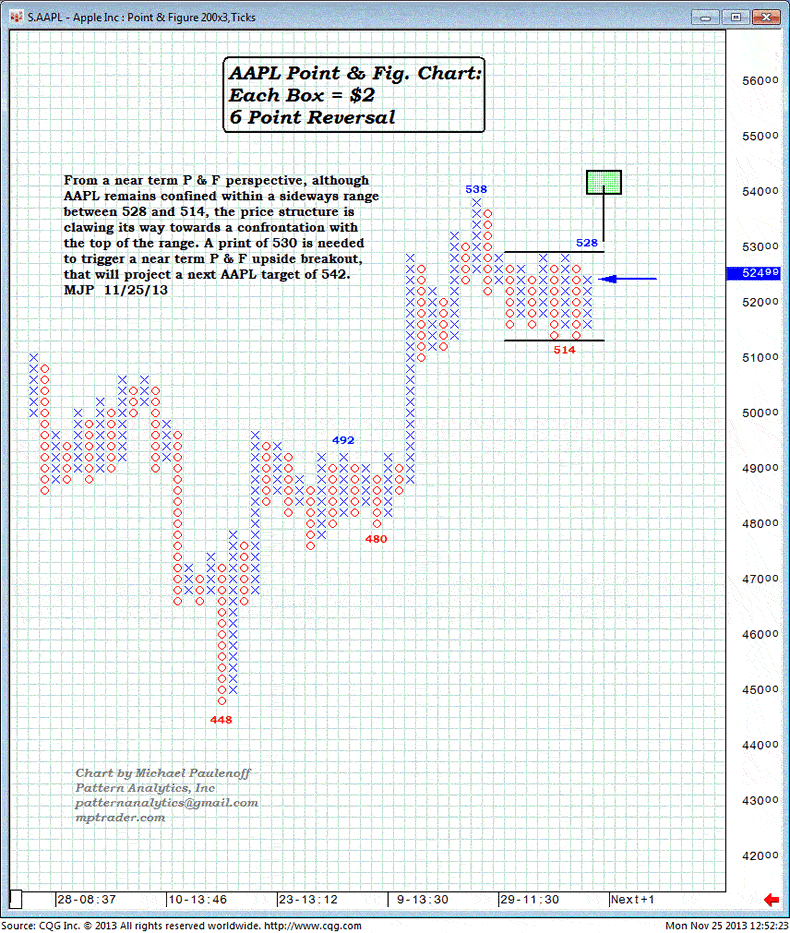
From a near-term P&F perspective, although Apple Inc. (AAPL) remains confined within a sideways range between 528 and 514, the price structure is clawing its way towards a confrontation with the top of the range.
A print of 530 is needed to trigger a near-term P&F upside breakout, that will project a next AAPL target of 542.

By Mike Paulenoff
Mike Paulenoff is author of www.MPTrader.com, a real-time diary of his technical analysis & trade alerts on ETFs for precious metals, energy, currencies, and an array of equity indices and sectors, including international markets, plus key ETF component stocks in sectors like technology, mining, and banking. Sign up for a Free 15-day Trial!
© 2002-2013 MPTrader.com, an AdviceTrade publication. All rights reserved. Any publication, distribution, retransmission or reproduction of information or data contained on this Web site without written consent from MPTrader is prohibited. See our disclaimer.
Mike Paulenoff Archive |
© 2005-2022 http://www.MarketOracle.co.uk - The Market Oracle is a FREE Daily Financial Markets Analysis & Forecasting online publication.


