Stock Market Intermediate Top Minimum Projection Reached!
Stock-Markets / Stock Markets 2013 Nov 25, 2013 - 09:58 AM GMTBy: Andre_Gratian
Current Position of the Market
SPX: Very Long-term trend - The very-long-term cycles are in their down phases, and if they make their lows when expected (after this bull market is over), there will be another steep decline into late 2014. However, the severe correction of 2007-2009 may have curtailed the full downward pressure potential of the 40-yr and 120-yr cycles.
Intermediate trend - Important top formation is in the making.
Analysis of the short-term trend is done on a daily basis with the help of hourly charts. It is an important adjunct to the analysis of daily and weekly charts which discusses the course of longer market trends.
MINIMUM PROJECTION REACHED!
Market Overview
By Friday's close, SPX had reached the minimum projection that was assigned to minute wave 5 (of intermediate V, of major 5, of primary III) -- a price level that could end the entire trend from October 2011.
EW labeling attempts to decipher the market structure, but his analysis has to be supported by other methodologies which probe other aspects of the market. Considering the current market position, we find that the minimum P&F projection has been reached; important cycles have topped; we have the worst case of negative divergence in daily oscillators which has been observed in months, with negative divergence being displayed in hourly oscillators as well; there is a significant decline in breadth momentum; the SentimenTrader indicator is giving us the highest readings seen in a very long time; and, for the past two weeks, relative weakness has begun to appear in NDX, RUT and the DOW transports, all of which tend to be early birds! Surely, at the very least, this is a time to exercise more than average caution!
And yet ... in the midst of all these negatives, there is a suggestion that we could go slightly beyond the "minimum" projection of 1804 before rolling over. Another 10 or fifteen points, maybe? There are certain areas of the market that need to give a little more confirmation; for example, the VIX does not look quite ready to start a meaningful uptrend.
Next week should bring all speculation to a conclusion.
Chart Analysis
The primary focus of this newsletter is to keep close track of the SPX. Therefore we'll review all three SPX trends: weekly, daily, and hourly (with charts courtesy of QCharts).
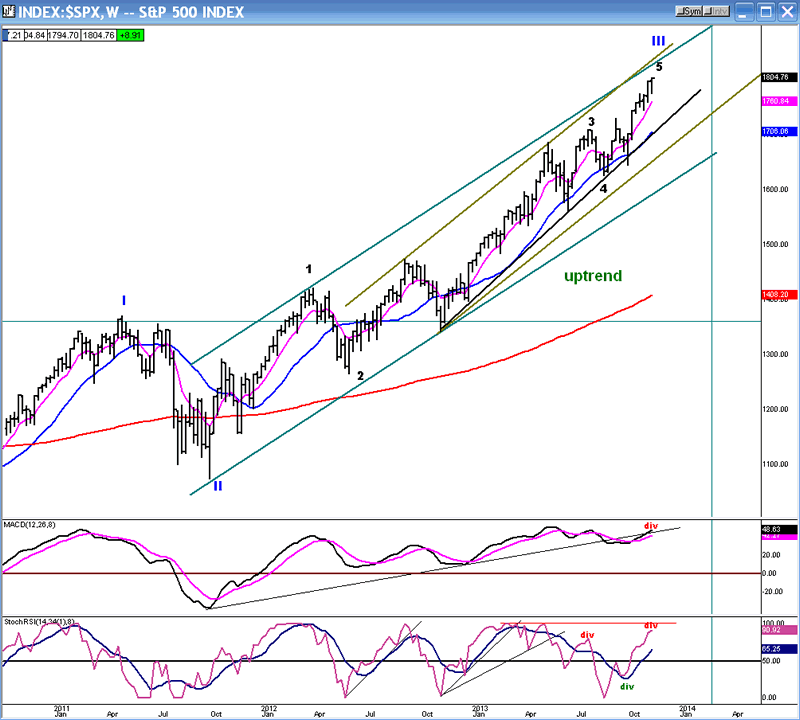
Starting with the weekly chart, I am showing a structure which appears to be the end of primary wave III. In addition to labeling the primary waves, I have also labeled the major waves (all EW labeling courtesy of Tony Caldaro). When we show the daily and hourly charts, I'll show the smaller waves that are also coming to a completion.
There is no question that the move into Friday's all-time high still has some upside momentum, but the oscillators do show some meaningful divergence. Neither the SRSI, nor the MACD has been able to rise above its May peak even though SPX is now trading more than one hundred points higher. Unless that divergence is eradicated, this chart alone is urging caution. At the same time, it tells us that this is unlikely to be the top of the bull market.
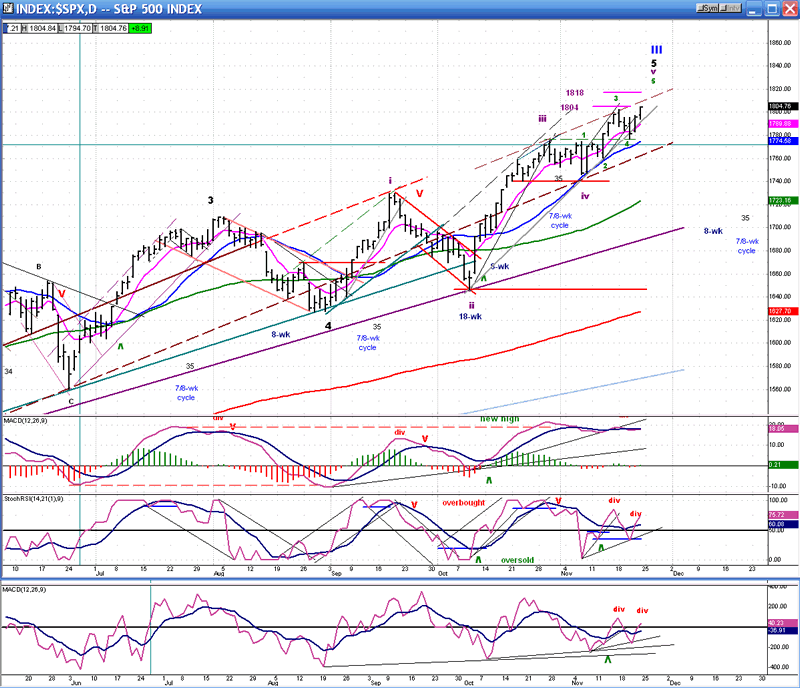
The daily chart (past 6 months) extends the EW labeling to the minute level and shows why we are coming to such a critical point in this uptrend. As mentioned above, I use several other methodologies to confirm the EW analysis. Based on the P&F count, I am suggesting two price levels (1804 and 1818) where the rally could come to an end. 1804 was reached Friday, at the close. If we do not start a serious decline from the opening on Monday, there is a good chance that the index will make an attempt at reaching the next level of 1818 before reversing.
There is a short-term trend line which has been touched 4 times and each time has failed to produce good upside momentum. In addition, the last two days show a decline in trading volume. This means that there are fewer and fewer buyers at these levels. When the trend line is finally broken, and the index drops below the last near-term low of 1777, we should see the selling intensify.
An uptrend which loses momentum with declining volume is hardly a bullish sign, but the bearish signs are far more telling in the oscillators. Except for the MACD which is only mildly bearish, the other two are as bearish (and more) as I have seen in months. The MACD is reflecting the fact that the move has been almost straight up since the 1646 low, with only mild pull-back, since. This is one of the reasons I think that we could have a pull-back followed by one more small wave up before real weakness appears. This would put the MACD in a better position to go negative.
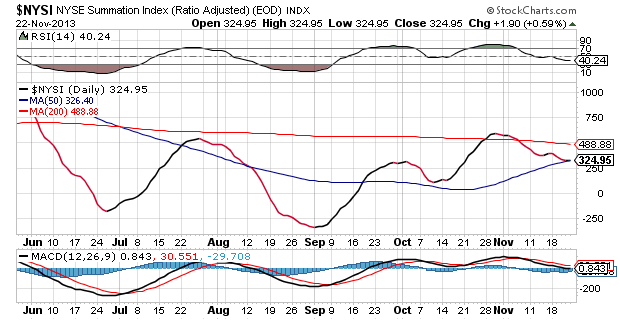
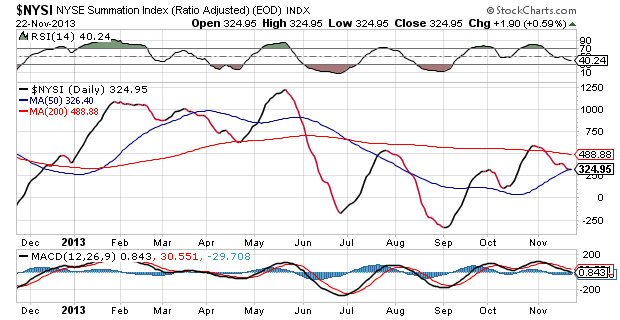
I am displaying the McClellan Summation Index below the chart in order to show more vividly the contrast which exists between breadth and price. The SPX paused briefly in late October, but resumed its uptrend in November. Not so with the NYSI which rolled over at the same time, but has kept on declining while SPX rallied.
One more thing! There are a couple of short-term cycles due to bottom toward the middle of December. Add that to the entire picture and it enhances the probability of a reversal being due imminently.
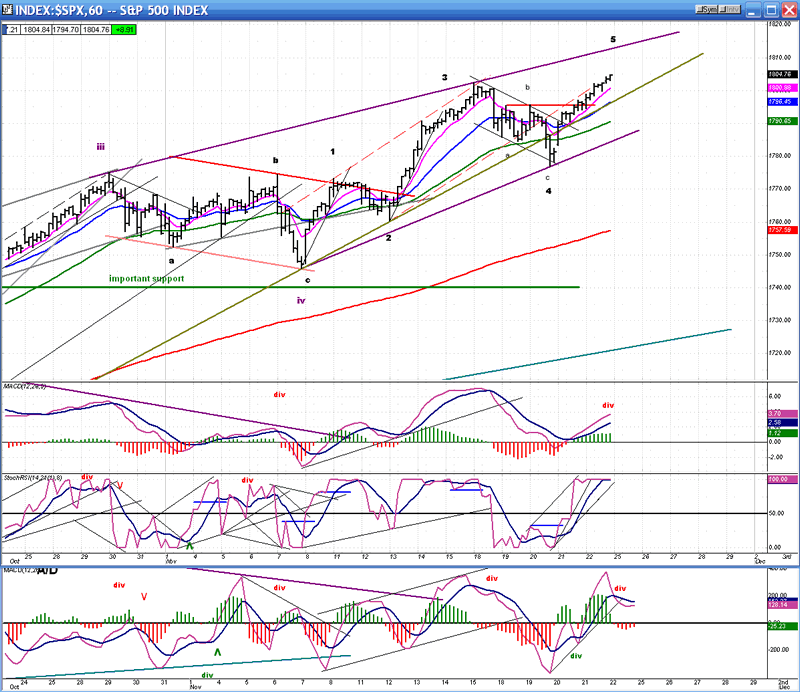
Let's next look at the hourly chart. Here, we can see the smaller waves in more detail, including the fact that wave 5 could have made its top on Friday by printing 1804 at the close. The oscillators are not disputing that possibility. Both MACDs (price and breadth) are showing negative divergence and the SRSI (in the middle) is overbought and ready to turn down.
What we don't know is if the structure of minute wave 5 is complete or requires and extension. So we'll wait and see what happens over the next 2 or 3 days. If incomplete, wave 5 should extend a little higher after some near-term consolidation.
Cycles
Same as last week! The longer-term cycles are undergoing some mild, right translation (topping past their scheduled high point), but should soon have their anticipated effect on prices.
We also discussed an 8-wk cycle (closely followed by a 7/8-wk cycle) that was due in the middle of next month. Downward pressure from these should get something started on the downside.
Breadth
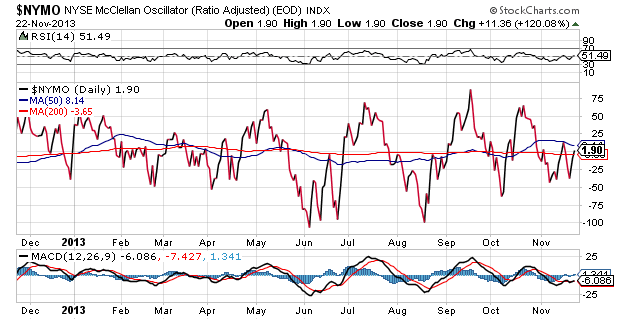
The McClellan Oscillator and the Summation index (courtesy of StockCharts.com) appear below. I posted the NYSI under the SPX daily chart, but here I have it under the McClellan Oscillator which is its basic component. It's just another perspective to emphasize the need for caution. With this kind of relative weakness in breadth vs. price, it's a fairly safe bet that weakness will soon follow in the latter.
Sentiment Indicators
The SentimenTrader (courtesy of same) long term indicator closed at 70 for the third consecutive week. If we move a little higher in price before starting to correct, this indicator may reach 80 -- an even more bearish rating.

VIX
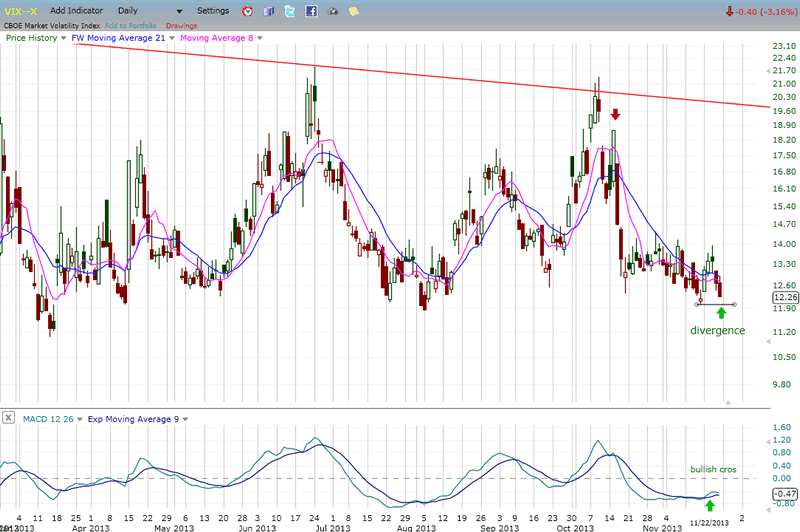
On 10/18 VIX made a low followed by a base pattern. However, on 11/15, it made a new, slightly lower low. This had the effect of delaying the market top until divergence was re-established. During the past week, SPX made a new high, but VIX remained above its November low, re-creating the lost divergence. Next, we need to look for signs that VIX is ready to start an uptrend in earnest. The first one may have already been given by the MACD which has made a bullish cross.
IWM (ETF for Russell 2000)
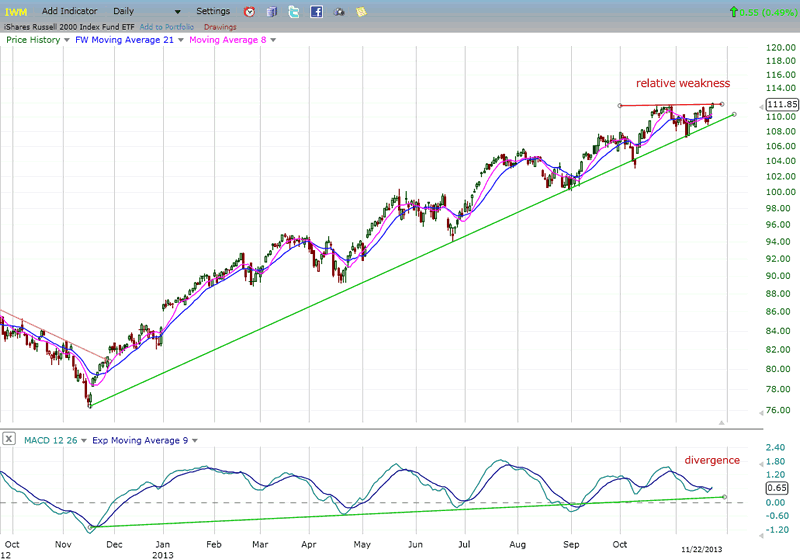
I am replacing XLF with IWM which, in my opinion, is a much more reliable leading index. At the end of October, IWM started to diverge significantly from SPX. After a short correction, the index had a weak rally which, only on Friday, managed to make a fractional new high. This index has consistently warned of approaching tops and bottoms by diverging from SPX at those times, and it is doing so now - with pronounced negative divergence showing in its MACD. Unless its current uptrend is extended significantly next week, the warning will remain in place.
BONDS
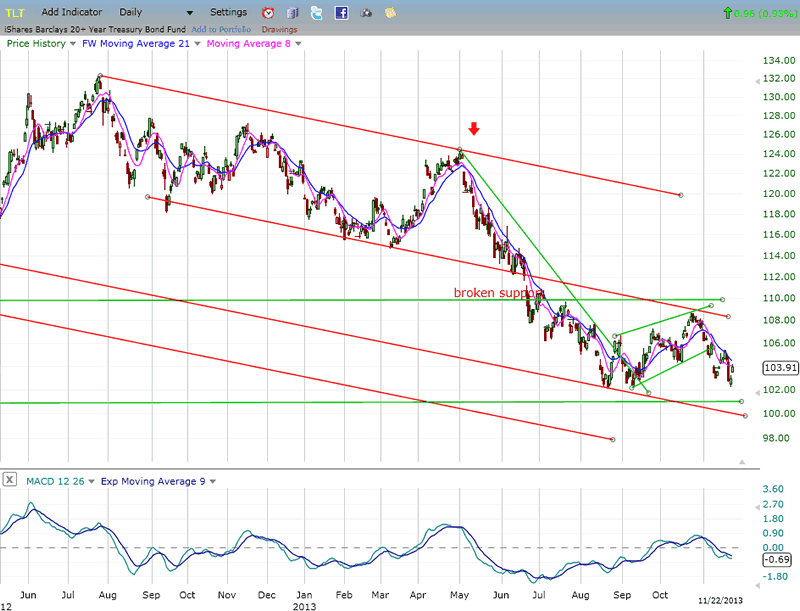
TLT is re-testing its low -- so far successfully -- with a bounce. We need to give it a little time to see if it will hold there or move lower to the next support level and to the bottom of the red channel.
GLD (ETF for gold)
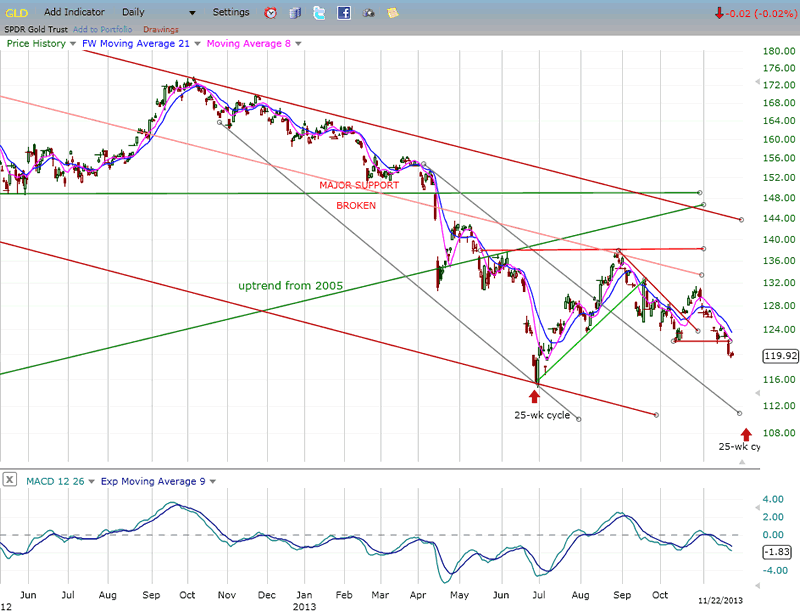
By breaking below its short-term support level, GLD looks ready to challenge its former long-term downtrend low. Since it is still about a month away from its next 25-wk cycle low, it is becoming likely that that low will not hold either, and that GLD will drop down to the target level of 107/110 that I have mentioned before.
UUP (dollar ETF)
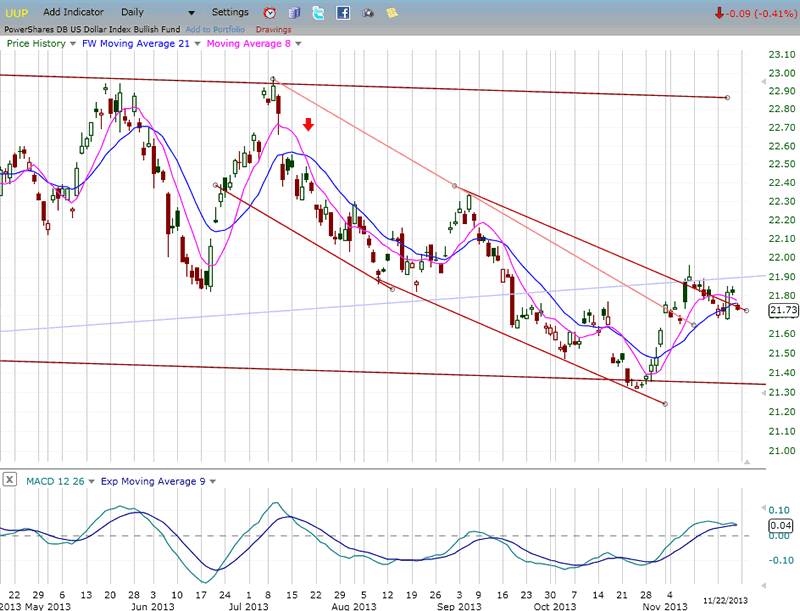
UUP found support at the base of a large corrective channel and had a good move which looks like a break out of its current downtrend. After a brief resting period during which it retained the majority of its gain, it appears ready to resume its uptrend. Its next move could challenge the former short-term high around 22.30.
OIL- WTIC (spot oil - EOD)
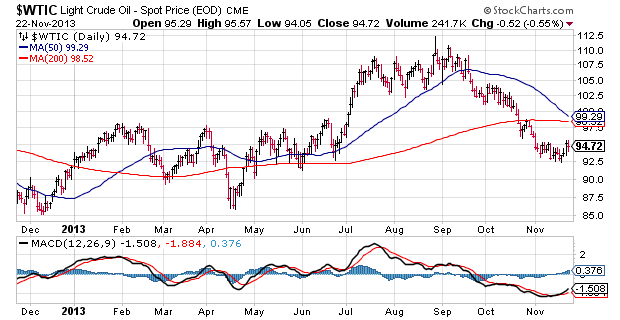
Based on P&F analysis, WTIC (chart courtesy of StockCharts.com) is in a protracted decline with an intermediate target of 86/87. This count breaks down in two separate phases and, by dropping to 93, the index has satisfied the first phase projection which coincides with a very strong support level, as you can see on the chart below.
We cannot know, at this time, for how long the 5-month congestion pattern will provide support before WTIC continues down to the bottom of that pattern to fulfill its 86 projection (or if it will). Before this takes place, it is likely that it will try to rally or simply trade sideways in a narrow range for a while. We need to give it some time to clarify its intentions.
Summary
I believe that SPX is making a compelling case for wanting to make an intermediate top in this area. We will probably not have long to wait for confirmation since it has already reached its minimum price objective of 1804. There are slightly higher potential counts which may have to be satisfied as well.
Although nothing is for sure in market analysis, the onus is on SPX to prove that it is capable of nullifying the plethora of negative warnings and continue to rally. If it cannot, we can probably expect a significant decline while the index traces out primary wave IV. When that is complete, primary wave V should take us to the top of the bull market which started in 2009.
FREE TRIAL SUBSCRIPTON
If precision in market timing for all time framesis something that you find important, you should
Consider taking a trial subscription to my service. It is free, and you will have four weeks to evaluate its worth. It embodies many years of research with the eventual goal of understanding as perfectly as possible how the market functions. I believe that I have achieved this goal.
For a FREE 4-week trial, Send an email to: ajg@cybertrails.com
For further subscription options, payment plans, and for important general information, I encourage
you to visit my website at www.marketurningpoints.com. It contains summaries of my background, my
investment and trading strategies, and my unique method of intra-day communication with
subscribers. I have also started an archive of former newsletters so that you can not only evaluate past performance, but also be aware of the increasing accuracy of forecasts.
Disclaimer - The above comments about the financial markets are based purely on what I consider to be sound technical analysis principles uncompromised by fundamental considerations. They represent my own opinion and are not meant to be construed as trading or investment advice, but are offered as an analytical point of view which might be of interest to those who follow stock market cycles and technical analysis.
Andre Gratian Archive |
© 2005-2022 http://www.MarketOracle.co.uk - The Market Oracle is a FREE Daily Financial Markets Analysis & Forecasting online publication.


