


How to Spot High-Confidence Trading Opportunities Using Moving Averages
InvestorEducation / Learn to Trade Nov 22, 2013 - 09:01 PM GMTBy: EWI

 The moving average is a technical indicator which has stood the test of time. It's been 27 years since Robert Prechter described this vital tool in his famous essay, "What a Trader Really Needs to be Successful." What he said then remains true today:
A simple 10-day moving average of the daily advance-decline net, probably the first indicator a stock market technician learns, can be used as a trading tool, if objectively defined rules are created for its use.
What is a moving average? Here's how EWI's Jeffrey Kennedy puts it:
A moving average is simply the average value of data over a specified time period, and it is used to figure out whether the price of a stock or commodity is trending up or down.
He also says that you can think of a moving average as an automated trend line.
A 20-year veteran of technical analysis, Jeffrey wrote "How You Can Find High-Probability Trading Opportunities Using Moving Averages."
[Descriptions of the following charts are summaries from that eBook]:
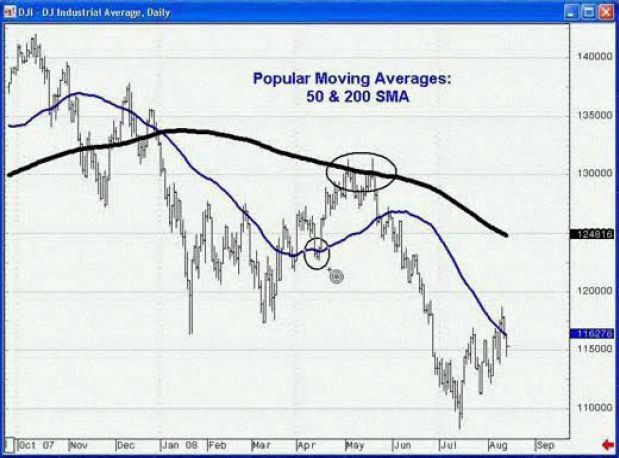
Let's begin with the most commonly-used moving averages among market technicians: the 50- and 200-day simple moving averages. These two trend lines often serve as areas of resistance or support.
For example, the chart below shows the circled areas where the 200-period SMA provided resistance in an April-to-May, 2008 upward move in the DJIA (top circle on the heavy black line), and the 50-period SMA provided support (lower circle on the blue line).
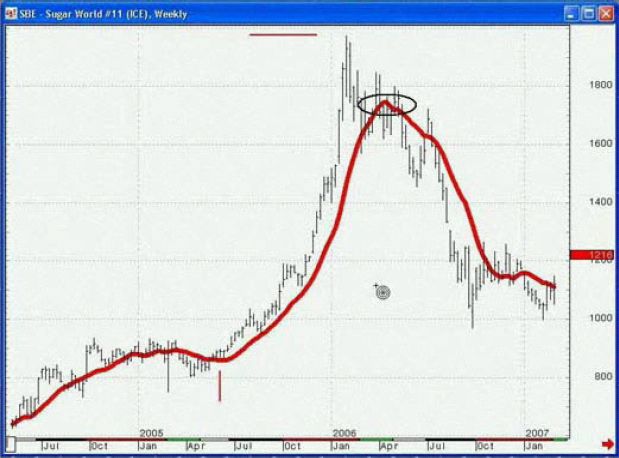
Let's look at another widely used simple moving average which works equally well in commodities, currencies, and stocks: the 13-period SMA.
In the sugar chart below, prices crossed the line (marked by the short, red vertical line), and that cross led to a substantial rally. This chart also shows a whipsaw in the market, which is circled.
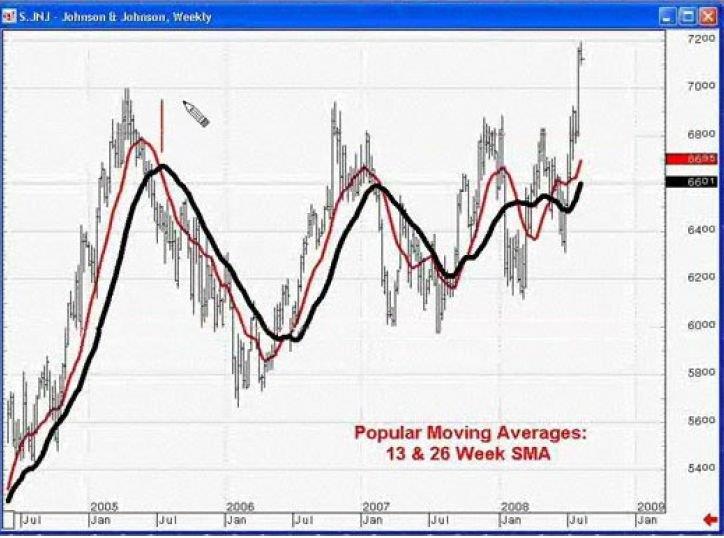
Another popular moving average setting that many people work with is the 13- and the 26-period moving averages in tandem.
The chart of Johnson and Johnson shows a crossover system using a 13-week and a 26-week simple moving average of the close. Obviously, the number 26 is two times 13. During this four-year period, the range in this stock was a little over $20.00, which is not much price appreciation. This dual moving average system worked well in a relatively bad market by identifying a number of buyside and sellside trading opportunities.
|
You can read the first two chapters of this eBook FREE for a limited time. The first two chapters reveal:
Jeffrey's insights are all about helping you become a better trader. Remember, the first two eBook chapters are FREE, so take advantage of this limited-time offer. |
This article was syndicated by Elliott Wave International and was originally published under the headline Spot High-Confidence Trading Opportunities Using Moving Averages. EWI is the world's largest market forecasting firm. Its staff of full-time analysts led by Chartered Market Technician Robert Prechter provides 24-hour-a-day market analysis to institutional and private investors around the world.
About the Publisher, Elliott Wave International
Founded in 1979 by Robert R. Prechter Jr., Elliott Wave International (EWI) is the world's largest market forecasting firm. Its staff of full-time analysts provides 24-hour-a-day market analysis to institutional and private investors around the world.
© 2005-2022 http://www.MarketOracle.co.uk - The Market Oracle is a FREE Daily Financial Markets Analysis & Forecasting online publication.