


The Coming Bust of the Great Bakken Oil Field
Commodities / Oil Companies Nov 21, 2013 - 03:51 PM GMTBy: Steve_St_Angelo

 There has been a lot of Fanfare on the huge increase of oil production coming from the Bakken Field located in North Dakota. There are many stories of people moving to the state to take advantage of the new OIL BOOM. It seems like everyone is going there to start a new life and make it rich in one of the coldest areas in the United States.
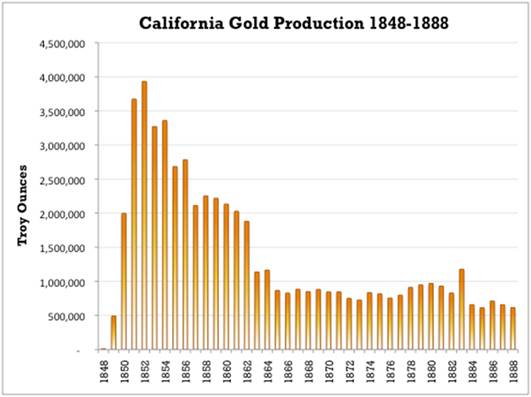
However, with all BOOMS, comes the inevitable BUST. This was true shown by the famous example of the 1800's California gold rush:
According to the article, "The Bakken Boom: The Modern Day Gold Rush":
Despite the low productivity of the labor-intensive process of gold panning, annual production grew from just over 1,400 ounces in 1848 to more than 3.9 million ounces by 1852. To put this into perspective, prior to 1848, cumulative U.S. gold production amounted to just over 1 million ounces.
Of course nuggets are easier to find than flakes, and the great majority were discovered in the first few years. By 1852, only four years after gold was first discovered, California gold production began a rapid descent. Production declined 50% by 1862 and 80% by 1872.
The decline was only barely checked by the adoption of ‘hydraulic mining’ – a process by which massive amounts of water under intense pressure is used to disintegrate entire hillsides. At the North Bloomfield mine, for example, 60 million gallons of water per day eroded more than 41 million cubic yards of debris between 1866 and 1884. (http://www.sierranevadavirtualmuseum.com/docs/galleries/history/mining/hydraulic.htm)
Typical of all BOOMS, production increases exponentially, peaks and then declines in the same fashion. However, Even with high-tech hydraulic water mining techniques, the industry could never produce more gold than it did in 1852 when it reached nearly 4 million ounces.
BAD NEWS FOR THE BAKKEN: Decline Rate of 63,000 Barrels A Day
The EIA - U.S. Energy Information Agency is now putting out data on the individual shale oil and gas plays in the country. While the American public and world have been made aware of the huge increase in oil production coming from the Bakken, few are privy to the dark side of the equation. The Bakken's daily decline rate from their existing oil wells has reached a staggering 63,000 barrels a day.
This means, that every day the Bakken pumps oil, its existing wells are now declining 63,000 (bd) barrels a day. As you can see from the chart above, the rate really started to decline in a big way after 2011 when the average daily decline was only 20,000 bd. In less than 3 years, this rate has increased more than 3 times (63,000 bd).
This next chart gives us the total as well as net oil production increases month over month:
The EIA is showing what is indicated to take place in December over November. If we look at the actual data that comes out of the North Dakota Department of Mineral Resources, Bakken oil field production in September hit 867,123 bd. The difference to reach that 1 million barrels a day is coming from the Montana portion of the Bakken.
Here is an actual screenshot of the ND DMR's monthly report released November 5th:
Moreover, if we look at total production, again using the North Dakota DMR's data, their total oil production data for the state in September was 931,940 bd. This includes oil production outside the Bakken and Three Forks (data for Bakken in the EIA charts includes Three Forks).
Astonishingly, 93% of North Dakota's oil production comes from the Bakken region alone.
The Bakken Drilling Frenzy Gives The Illusion of Sustainable Growth
The typical American believes the United States has all this hidden oil and gas resources that we can easily tap into. I just had a conversation with a neighbor yesterday who told me that he couldn't understand why we weren't "ENERGY INDEPENDENT." Gosh, if I had a dollar for every time someone said that...
Again, the public is only told about all the huge increases in production, but for some strange reason, MSM tends to omit the negative side. The only way oil production is increasing in the Bakken is due to the massive amount of new wells that have been added. The chart below reveals the illusion of this sustainable growth:
First, the figures in white represent North Dakota's total wells producing for their production of the Bakken. Even though the graph includes Montana's production, it still gives us a good idea of the huge increase in oil wells it takes to grow production.
Second, in 2008, the Bakken in North Dakota only had 479 producing wells, however at last count in September when then Bakken was producing 867,123 barrels of oil a day, it took 6,447 wells to do so. Thus, the energy companies drilling and producing oil in the Bakken have to keep increasing wells each month (and year) to offset the huge 63,000 bd decline.
For example, there were an additional 135 new wells (ND) producing in Sept. over Aug. which added 20,589 bd of production. If there were only say 100-105 new wells added that month, production would have remained flat or possibly declined for Sept.
Lastly, the best and most productive wells are exploited first leaving the dead-beats for last. This will make things even more fun as the peak and subsequent bust finally arrives.
The Coming Bust of The Great Bakken Field
As with all oil fields, there are only so many sweet spots and areas to drill. The 63,000 bd decline rate at the Bakken only has one way to go -- and that's higher. If the present trend continues (highly likely) then we are going to see a daily decline rate of 75-85,000 barrels a day by the end of 2014.
Thus, the shale oil players are going to have to make those drilling hamsters work even harder as they will need to increase more wells each month just to grow production. At some point in time (sooner rather than later), the daily decline rate will reach a figure that these companies will be unable to offset.
There are only so many drilling locations available and once they run out, the Great Bakken Field will become a BUST as the high decline rates will push overall oil production down the very same way it came up.
Those who moved to the frigid state of North Dakota with Dollar signs in their eyes and images of sugar-plums dancing in their heads will realize firsthand the negative ramifications of all BOOM & BUST cycles. At this time, the word "Cold" will have more than one meaning.
Once the Bakken and Eagle Ford oil fields peak and decline, the United States has no other "ENERGY RABBIT" in its hat. This is precisely why investors need to understand energy and why it's important to own physical assets such as gold and silver.
Check back for more updates at the SRSrocco Report.
At the SRSrocco Report, we will explore how energy will impact the mining industry in the future. Falling ore grades and decreasing yields are only part of the problem. As net oil exports continue to decline, energy prices will rise putting more pressure on the mining industry. Thus, rising energy costs will guarantee rising prices of gold and silver.
© 2013 Copyright Steve St .Angelo - All Rights Reserved Disclaimer: The above is a matter of opinion provided for general information purposes only and is not intended as investment advice. Information and analysis above are derived from sources and utilising methods believed to be reliable, but we cannot accept responsibility for any losses you may incur as a result of this analysis. Individuals should consult with their personal financial advisors.
© 2005-2022 http://www.MarketOracle.co.uk - The Market Oracle is a FREE Daily Financial Markets Analysis & Forecasting online publication.