


Is a Stocks Bear Market Right Around the Corner?
Stock-Markets / Stocks Bear Market Nov 21, 2013 - 03:09 PM GMTBy: PhilStockWorld

 Courtesy of Doug Short.
What the 2007 Top Can Tell Us about the Present
The most famous law of economics that everyone learns in Econ 101 is the law of supply and demand. Essentially, if there are more buyers than sellers then prices will go up until equilibrium is reached. Conversely, if there are more sellers than buyers prices will decline. The stock market is no different.
If there are more buyers of stocks than sellers, the stock market will rise and will continue to do so until either the ranks of willing buyers thins out and/or the ranks of sellers grows. When equilibrium is reached between buyers and sellers a market begins to stall. When you have a continued stream of sellers dumping their holdings, a bear market ensues.
One way to visualize this is to use the analogy of the change in seasons. In the midst of summer you see trees swelling with green leaves. As you begin to transition into the fall leaves begin to turn from green to red and as you enter winter the leaves begin to fall from the tree. By the dead of winter most deciduous trees are barren as all the leaves have fallen. Think of the stock market as one big deciduous tree full of green leaves (stocks) during a bull market.
As momentum begins to wane you can see several negative divergences in the market take place similar to leaves changing from green to red. As a bull market top begins to form, individual leaves (stocks) begin to fall off the tree and soon there is an even balance between leaves on the tree and leaves on the ground. Eventually, the scales are tipped and there are more leaves falling than remain on the tree and you have officially entered winter (a bear market).
By looking at the stock market as one big tree full of thousands and thousands of leaves one can gain a better understanding of what season the market is in to determine if there are more buyers or sellers. The trick, as usual, is in measurement. One simple way to do this is by measuring a stock’s distance from its 52-week high. If there are more stocks closer to their 52-week highs than those in their own private bear markets (have already fallen off the investment tree) then the bull market remains alive.
A Look at the 2007 Peak
The market peaked on October 9th, 2007 when the S&P 1500 hit a high of 353.92. The S&P 1500 is a super composite of the S&P 500 (500 large cap stocks), the S&P 400 (400 mid cap stocks) and the S&P 600 (600 small cap stocks), and was used for looking at the 2007 top due to its large sample size of operating-only companies. You can see that the day the market put in its high, only 24% of the 1500 stocks in the S&P 1500 were within 20% of their 52-week highs and you had 23% that were already off by 20% or more from their 52-week highs, officially entering a bear market. Some may be surprised to hear that the day the market peaked ? of the entire market was already in a bear market and given the near one to one ratio between those near their highs and those already in a bear market, it is not surprising to see the market was in the process of putting in a market top.
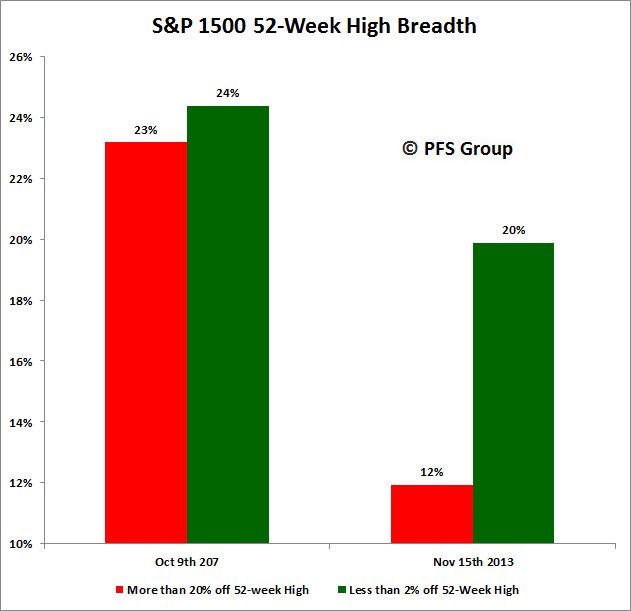
Conversely, looking at the data as of the new highs hit on Friday November 15th, there was nearly a 2:1 ratio between stocks near their highs versus those already in a bear market. Clearly there are more buyers than sellers at the present time and no indication of a market top.
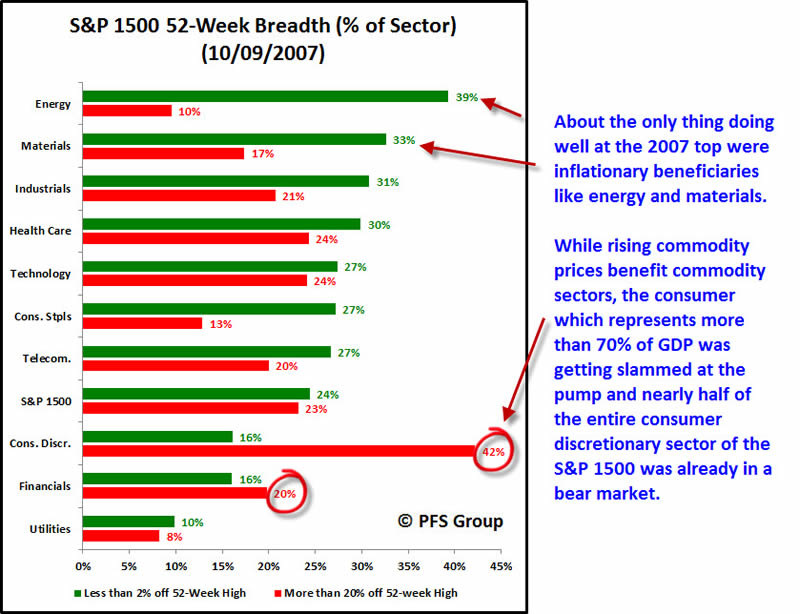
We can glean even more information from the 2007 top when looking at sector 52-week breadth data. As the figure below shows, the day the market peaked about the only thing working at the time were inflationary beneficiaries like the energy and materials sectors that were benefiting from commodity inflation. The flip side of the coin was the U.S. consumer who was feeling the pinch from rising food and energy inflation as their pocket books were being squeezed, which led to nearly half of the entire consumer discretionary sector succumbing to a bear market the day the market was hitting its final high. This clearly spelled trouble for the economy given the consumer makes up more than 70% of GDP.
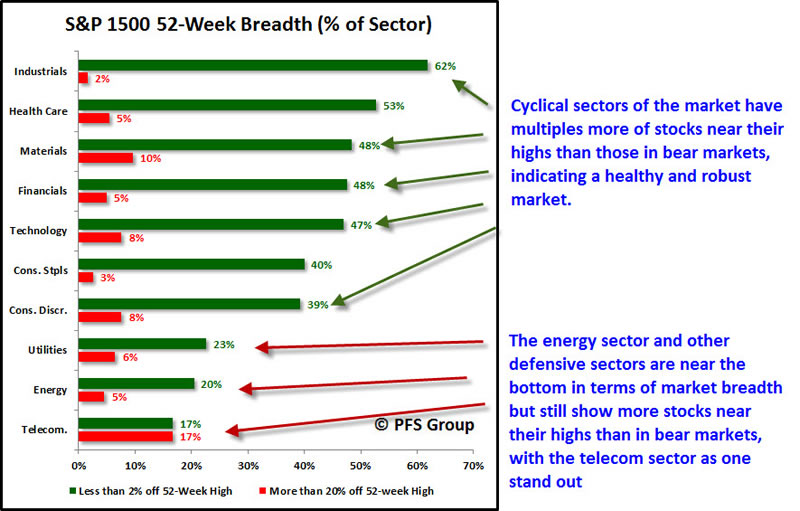
Looking at the data as of last Friday shows a much different picture in which new highs for every sector, except for telecom, trounces the percentage of those in bear markets and many of the market?s cyclically sensitive sectors are sitting near the top while the energy sector ranks near dead last, a polar opposite picture to what was seen in 2007.
Another way to visualize the handoff between the bulls and the bears for market tops is to look for when the spikes in 52-week lows exceeds the spikes in 52-week highs. When this occurs the bears become the dominant market force and a market top is formed. This handoff took place during the July 2007 sell off when the spike in new 52-week lows exceeded the prior spike in 52-week highs and marked the 2007 top.
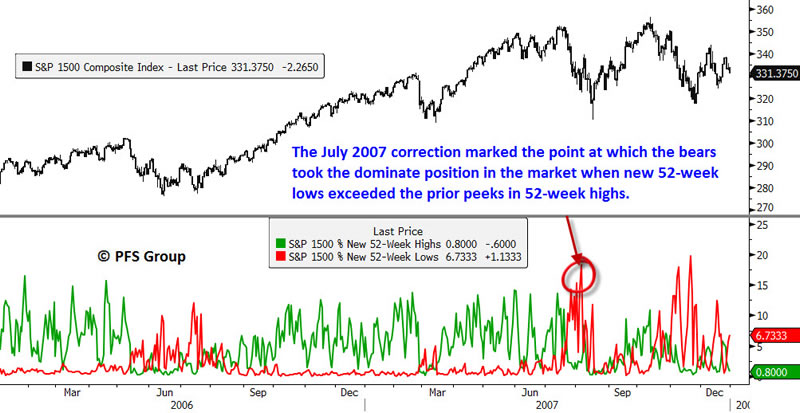
Source: Bloomberg
Looking at the present situation shows the bears are nowhere to be seen and remain in hibernation while the bulls maintain firm control of this current market.
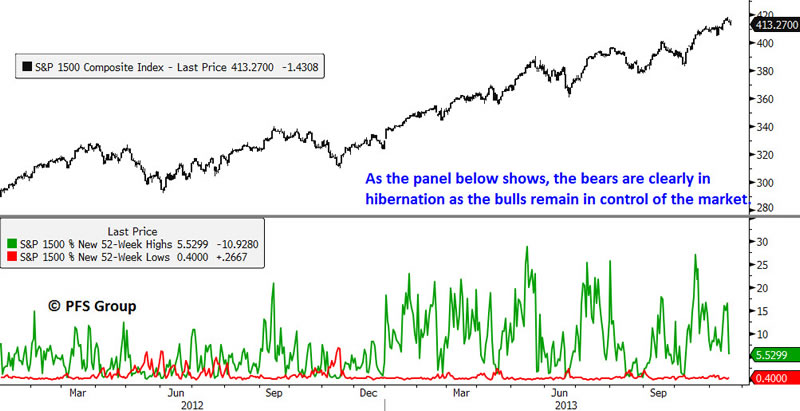
Source: Bloomberg
Summary:
Understanding the basic forces of supply and demand and how they work in the stock market helps one understand if a market is topping or not. Reviewing the 2007 top showed at the peak there was a near equal measure of stocks near their highs versus those already in a bear market. As more sellers entered, the devastating 2007-2009 bear market commenced and devastated investors worldwide. Reviewing similar metrics for gauging supply and demand in the stock market today shows that there are nearly twice as many buyers as sellers in the market and why it also isn?t surprising to see the market continue to advance higher. Additionally, looking at the sector level in the current situation relative to the 2007 is also encouraging as many economically sensitive sectors continue to show leadership.
In summary, looking at the current market climate relative to the 2007 top shows a market that is nowhere close to putting in a major market top. For further research on this topic, please click here.
Originally posted at Financial Sense
(c) PFS Group
PFS Group
- Phil
Philip R. Davis is a founder of Phil's Stock World (www.philstockworld.com), a stock and options trading site that teaches the art of options trading to newcomers and devises advanced strategies for expert traders. Mr. Davis is a serial entrepreneur, having founded software company Accu-Title, a real estate title insurance software solution, and is also the President of the Delphi Consulting Corp., an M&A consulting firm that helps large and small companies obtain funding and close deals. He was also the founder of Accu-Search, a property data corporation that was sold to DataTrace in 2004 and Personality Plus, a precursor to eHarmony.com. Phil was a former editor of a UMass/Amherst humor magazine and it shows in his writing -- which is filled with colorful commentary along with very specific ideas on stock option purchases (Phil rarely holds actual stocks). Visit: Phil's Stock World (www.philstockworld.com)
© 2013 Copyright PhilStockWorld - All Rights Reserved Disclaimer: The above is a matter of opinion provided for general information purposes only and is not intended as investment advice. Information and analysis above are derived from sources and utilising methods believed to be reliable, but we cannot accept responsibility for any losses you may incur as a result of this analysis. Individuals should consult with their personal financial advisors.
PhilStockWorld Archive |
© 2005-2022 http://www.MarketOracle.co.uk - The Market Oracle is a FREE Daily Financial Markets Analysis & Forecasting online publication.