Gold and Silver Bullish Chart Indications
Commodities / Gold & Silver Apr 13, 2008 - 10:31 PM GMTBy: Joe_Nicholson
“Risk is clearly to the… downside for gold and silver, even if relatively minor advances are seen intraweek.” ~ Precious Points: Still Unstable, April 06, 2008
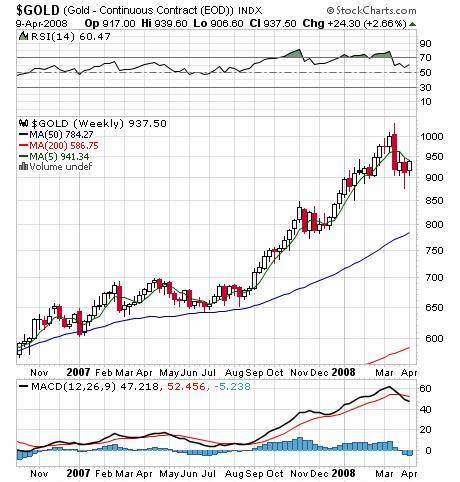
Tuesday was a good week for commodities, including the precious metals, but any readers of this update should have been skeptical, particularly since the rally in gold was halted exactly at the 5-day and 5-week moving averages! Though a relatively unsophisticated and unglamorous technique amongst the analysts' varied tools, moving averages continue to be incredibly telling in the precious metals.

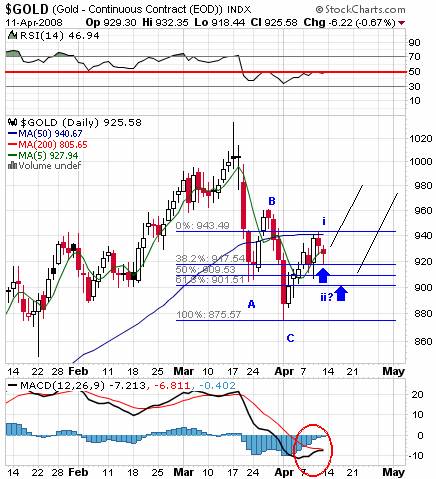
Support and resistance at the moving averages has so far contained the rallies in gold, but prevented new lows. This situation may be about to change. The wave count in the chart below, showing important support at about 900 and the 38.2% retrace of the move off the recent bottom, is probably the most bullish case for gold from here. More immediately, however, gold faces resistance in the RSI and a MACD kissback, both of which will either break through bullishly or send gold searching for support lower.

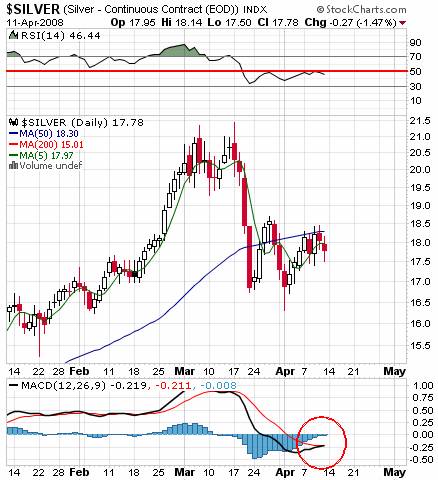
The daily chart below reveals a similar situation in silver: resistance in the RSI and at key moving averages, and a kissback in the MACD that can either look very good on a bullish crossover or very bad on a failure.

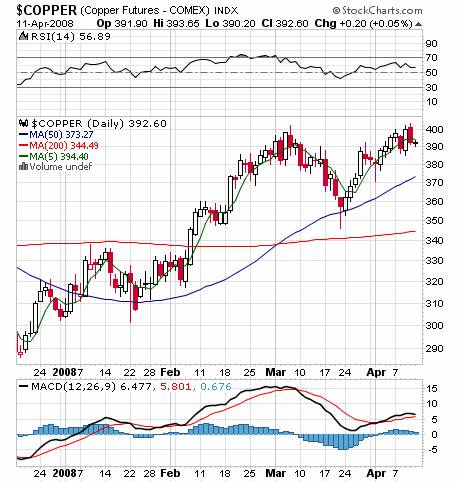
In contrast, compare the copper chart below, where the technical indicators describe a far more robust and healthy market. The one flaw? Copper closed Friday below the 5-day sma for the first time since mid-March.

TTC will close soon to new membership.
We originally thought we would close the doors to new retail in June or July, but I've decided to move that up closer to May 31, Memorial Day weekend. The opportunity to join the TTC community of traders is slipping away from retail investors. If you're really serious about trading learn more about what TTC has to offer and how to join now .
So, do you want to learn how to trade short term time frames? Would you like access to next week's charts posted in the weekly forum right now? Ten to twenty big picture charts are posted every weekend. If you feel the resources at TTC could help make you a better trader, don't forget that TTC will be closing its doors to new retail members on May 31, 2008 . Institutional traders have become a major part of our membership and we're looking forward to making them our focus.
TTC is not like other forums, and if you're a retail trader/investor looking to improve your trading, you've never seen anything like our proprietary targets, indicators, real-time chat, and open educational discussions. But the only way to get in is to join before the lockout starts - once the doors close to retail members, we'll use a waiting list to accept new members from time to time, perhaps as often as quarterly, but only as often as we're able to accommodate them. Don't get locked out later, join now.
Have a profitable and safe week trading, and remember:
"Unbiased Elliott Wave works!"
by Joe Nicholson (oroborean)
This update is provided as general information and is not an investment recommendation. TTC accepts no liability whatsoever for any losses resulting from action taken based on the contents of its charts,, commentaries, or price data. Securities and commodities markets involve inherent risk and not all positions are suitable for each individual. Check with your licensed financial advisor or broker prior to taking any action.
Joe Nicholson Archive |
© 2005-2022 http://www.MarketOracle.co.uk - The Market Oracle is a FREE Daily Financial Markets Analysis & Forecasting online publication.


