Stock Market All Time Highs
Stock-Markets / Stock Markets 2013 Nov 17, 2013 - 01:01 PM GMTBy: Tony_Caldaro
 The market opened the week higher, tried to break out above SPX 1775, pulled back to 1761 Wednesday morning, then made all time new highs for the rest of the week. For the week the SPX/DOW were +1.45%, the NDX/NAZ were +1.70%, and the DJ World index was +1.5%. On the economic front negative reports out numbered positive ones 7 to 4. On the uptick: wholesale inventories, the monetary base, the WLEI and the Treasury deficit improved. On the downtick: export/import prices, the NY FED, industrial production, capacity utilization, plus both the trade deficit and weekly jobless claims were higher. Next week we get a look at the Philly FED, CPI/PPI, Retail sales and the FOMC minutes.
LONG TERM: the bull market continues
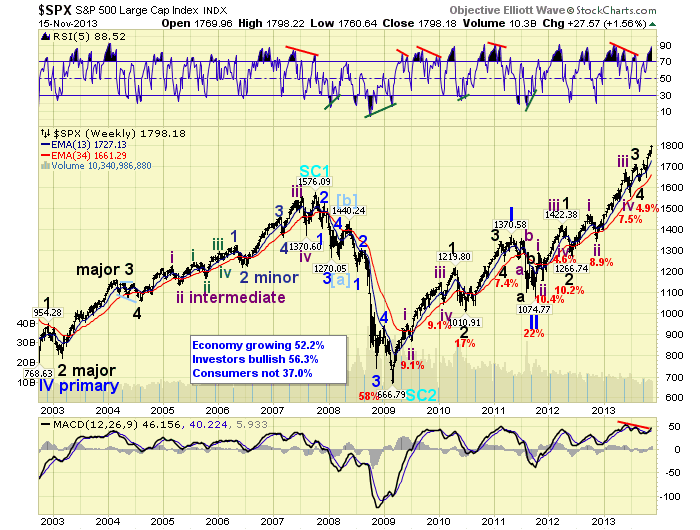
After the bear market low in Mar09, and the five waves up to form Major 1 in early 2010, we tracked Primary wave I until it peaked in early 2011. The 22% Primary wave II correction that followed was quite steep for even the choppiest of bull markets. During this time we analyzed Primary I, determined the characteristics of this bull market, and this eventually led to our projected bull market high within the OEW 1779 pivot range. We had noticed the first waves were strong, third waves were weaker, and fifth waves were the weakest of the three impulse waves. Our price assumption was that Primary waves III through V would equal all of Primary I.

This week those characteristics changed when Primary III in both the SPX and NDX exceeded the length of Primary I. This relationship, as many EW pundits would know, is generally what is considered normal: good first waves, stronger third waves, and a variable fifth wave. The general rule also suggests that once a third wave exceeds the equality of the first wave the next Fibonacci ratio is 1.618 times wave 1. This would suggest that Primary III would end around SPX 2200. We are certain you have heard this number being touted on the internet.
We took a look back at all the bull markets since the early 1980′s. Each time the third wave of a bull market reached that sort of relationship or greater to the first wave, the first wave was relatively small in time and price. During this bull market the SPX doubled during its first wave and it took about two years. That is anything but small. These types of 1.618 relationships work much better with smaller waves. Nevertheless, nothing can be totally ruled out in this type of FED/QE driven bull market. However, from a Fibonacci Primary III to Primary I wave relationship there are still two significant price levels ahead, SPX 1970 and SPX 2070, before SPX 2214 should even be considered.
MEDIUM TERM: uptrend
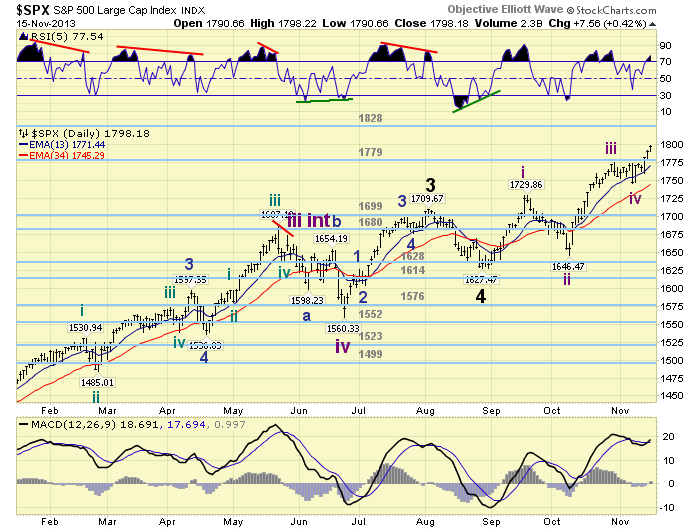
The SPX uptrend we have been tracking started back in August at 1627. This we have been labeling this low as the Major wave 4 low of Primary III. Thus far we have counted five waves up from that low. Four of which have completed and the fifth has been underway. Since this is Major wave 5 we are counting these five waves with an Intermediate degree: Int. i SPX 1730, Int. ii SPX 1646, Int. iii SPX 1775, Int. iv SPX 1746 and Int. v SPX 1798 thus far.

The market is gradually approaching the first resistance level for Int. wave v at SPX 1810. The next resistance level is at SPX 1826, which falls within the range of the next higher pivot: SPX 1828. After that we are looking at SPX 1849 and then SPX 1875. These levels are still quite a way from Friday’s SPX 1798 high/close. The next two OEW pivots above 1828 are 1841 and 1869. So these Fibonacci price levels and the pivots match up quite well. Technically we have seen an upturn in the daily MACD and RSI. But both are currently suggesting a potential negative divergence at Friday’s new highs. We will be monitoring this situation next week. Medium term support is at the 1779 and 1699 pivots, with resistance at the 1828 and 1841 pivots.
SHORT TERM
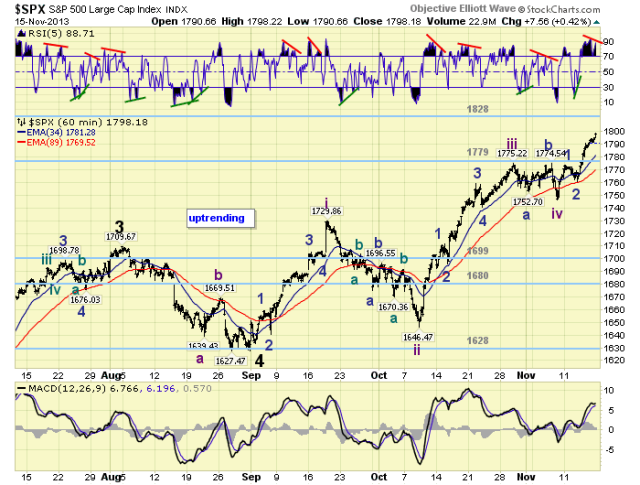
From the Major wave 4 SPX 1627 low Int. waves i and iii each unfolded in five Minor waves. Intermediate wave v is obviously unfolding in the same manor. Minor wave 1 rallied to SPX 1773, from the Int. wave iv low at SPX 1746. Minor 2 pulled back to SPX 1761 on Wednesday morning, and Minor wave 3 has been underway since then. Currently Minor 3 (37 pts.) is already longer then the somewhat short and quick Minor 1 (27 pts.). A Fibonacci 1.618 relationship would come into play in this situation, for these Minor waves, at SPX 1805. This is close to our SPX 1810 resistance level, which is based upon Intermediate waves. With a negative divergence building on the hourly chart we may see the market stall around those levels.

Short term support is at the 1779 pivot and SPX 1746, with resistance at SPX 1810 and the 1828 pivot. Short term momentum is displaying a negative divergence and quite overbought. The short term OEW charts remain positive with the reversal level at SPX 1781.
FOREIGN MARKETS
The Asian markets were mixed on the week but generated a 0.8% gain thanks to the 7.7% gain in Japan.
The European markets were also mixed but ending with a 0.1% loss.
The Commodity equity group were mixed but gained 1.0%.
The DJ World index remains in an uptrend and gained 1.5% on the week.
COMMODITIES
Bonds appears to be downtrending but gained 0.4% on the week.
Crude is downtrending and lost 0.5% on the week.
Gold is downtrending as well and lost 0.1% on the week.
The USD is uptrending but lost 0.5% on the week.
NEXT WEEK
Monday: the NAHB index at 10am. Wednesday: Retail sales, the CPI, Existing home sales, Business inventories and the FOMC minutes. Thursday: weekly Jobless claims, the PPI, the Philly FED and Leading indicators. Busy week for the FED. Tuesday: FED chairman Bernanke gives a speech at 7pm. Wednesday: FED director Gibson testifies before the Senate. Thursday: FED governor Powell gives a speech at 9:45. Friday: FED governor Tarullo gives a speech at 12:15. Busy week, wild bull market run, enjoy the weekend and the week!
CHARTS: http://stockcharts.com/public/1269446/tenpp
http://caldaroew.spaces.live.com
After about 40 years of investing in the markets one learns that the markets are constantly changing, not only in price, but in what drives the markets. In the 1960s, the Nifty Fifty were the leaders of the stock market. In the 1970s, stock selection using Technical Analysis was important, as the market stayed with a trading range for the entire decade. In the 1980s, the market finally broke out of it doldrums, as the DOW broke through 1100 in 1982, and launched the greatest bull market on record.
Sharing is an important aspect of a life. Over 100 people have joined our group, from all walks of life, covering twenty three countries across the globe. It's been the most fun I have ever had in the market. Sharing uncommon knowledge, with investors. In hope of aiding them in finding their financial independence.
Copyright © 2013 Tony Caldaro - All Rights Reserved Disclaimer: The above is a matter of opinion provided for general information purposes only and is not intended as investment advice. Information and analysis above are derived from sources and utilising methods believed to be reliable, but we cannot accept responsibility for any losses you may incur as a result of this analysis. Individuals should consult with their personal financial advisors.
Tony Caldaro Archive |
© 2005-2022 http://www.MarketOracle.co.uk - The Market Oracle is a FREE Daily Financial Markets Analysis & Forecasting online publication.


