


Gold Marking Time Before Next Down Leg
Commodities / Gold & Silver Apr 13, 2008 - 12:53 AM GMTBy: Merv_Burak

 Although gold closed the week about 1.2% ahead of last week it still seems to be going nowhere. Over the past month it has been tracing a lower low and lower high scenario. It looks like it is about to go into its next lower low phase but let's check the charts and indicators.
WHAT! ME WORRY?
As most of my readers know, over the years I have developed a series of Indices to try and assess what's happening to gold and silver stocks. These Indices are all listed as components of the Gold Indices Table of technical information and ratings (see at the end of this commentary). I have occasionally shown some of these Indices in this commentary (subscribers to my service get them all updated each week). The one Index that I rarely show, although it is included in the Gold Table, is the Merv's Gold & Silver 100 Index . I wouldn't go into the reasons for not showing it but I thought that it would be instructive to take a look at it today. The Index is shown here from the time just before reaching its 1996 - 1998 bear market low to the present. Included with the Index is a very long term simple moving average and a very long term price momentum indicator (the 52 week RSI). Let's see what this chart and indicator may be telling us.
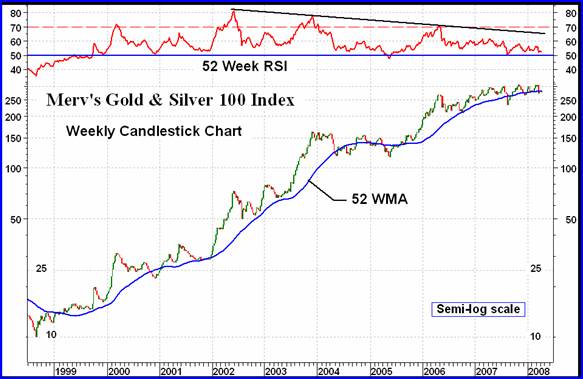
The 100 stocks in this Index represent the 100 largest gold and silver stocks traded on the North American markets, based upon their market value. The component stocks are reviewed a couple of times a year and updated accordingly. There may be stocks that are accidentally left out or that do not meet the criteria of having at least a year of active trading history to be able to include into the table. Other than that the majority of trading in gold and silver stocks can be found in these 100.
Most of the North American Indices are calculated by applying a weighting factor to the largest component stocks, with the smaller stocks having little effect on the Index value. The Merv's Gold & Silver 100 Index is calculated based upon the AVERAGE weekly performance of all component stocks. This gives each component stock the exact same weight towards the Index value. Which method is superior is mostly a personal preference.
Although not shown on this chart, the bear market from the high in 1996 to the low in 1998 took the Index down by two thirds in value, this in only a two year period. By time gold and most gold Indices were starting to show their new bull market in 2001 this Index was already ahead by 200% and was exceeding its 1996 bull market high. From its low in 1998 the 100 Index had gained about 3000% in value to its recent high.
Once the 52 Week RSI moved into its positive zone in 1999 it has stayed there throughout the bull market with only a minor drop into the negative in mid-2005. The RSI provides us with a suggestion of internal strength behind recent Index moves, based upon the appropriate time period used. Here we see the strength of the Index improving (the RSI increasing in value) until the RSI reached its high point in mid-2002. This was the almost identical high reached by this RSI at its bull market top in 1996. Every new thrust by the Index has been on ever deceasing RSI strength. On a semi-log scale we see that the Index itself has been going nowhere for over the past year. As the RSI continues to weaken and is once more almost to its neutral level, just above its negative zone, one can easily visualize the Index as performing a long term TOPPING pattern.
Now, we may be going through just another consolidation period similar to that of 2004 – 2005 with a sharp bull move ahead, but one should not assume so. There is a serious possibility that we might be in for a serious bear market ahead. I hope not but one should not dismiss the possibility. One can only follow the dictates of the on-going market action and not fight the tape. If a bull market should come upon us the tape will tell us so. If not, the tape will also tell us so. Fighting the tape is a loser's game. If some of you young traders do not know what the “tape” is, read some old stock market books.
As one might expect, not all of the gold and silver stocks are as dangerous looking as that of the 100 Index. Actually some gold and silver stocks are worse looking while some are better. A review of the various Merv's Indices is available to subscribers in their Update section.
GOLD : LONG TERM
Well, so much for gold and silver stocks. Now let's see what gold itself is doing. I am showing a long term chart of gold for the same time period and with the same indicators as the 100 Index above. This is for easy comparison of the movements between gold and the average performance of the top 100 gold and silver stocks. I'm not sure I would take my cue from the action by gold and then apply it to purchase or sale of stock. If you buy gold, go to the gold chart. If you buy stock go to an appropriate stock Index or chart.
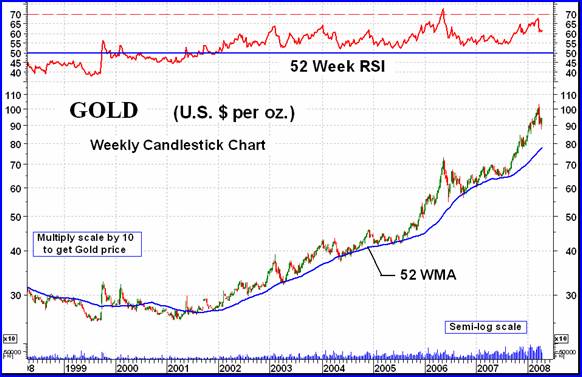
I'll just make a few brief comments between the chart of gold and that of the 100 Index. Readers may find far more interesting similarities and differences on their own.
The most notable differences between the two charts are in the RSI and recent gold strength. The RSI did not peak until mid 2006 versus the 100 Index peak in 2002. Although the price of gold has gained considerably since late 2006 its strength has diminished versus its strength in early 2006. Note the negative divergence in the RSI versus gold at the gold peak a few weeks ago. The sharp rise in gold price is nowhere to be found in the average price of the top 100 gold and silver stocks as represented by the 100 Index. Over time one or the other has to give. At this time I'm afraid it will be the price of gold. The recent RSI action between the two is not compatible. Gold could still drop quite a ways without putting the RSI into its negative zone while the 100 Index RSI has little maneuvering room from here. We'll just have to wait and see how the action develops from here.
Now back to the real world.
The long term P&F chart added another X to the chart shown last week. It has therefore not yet confirmed a bear signal although once it did we already have two downside projections shown last week.
As for the normal chart and indicators, looking at a daily version of the chart and indicators we still have the Index well above its long term positive sloping moving average line. The momentum indicator is also still in its positive zone but is below its negative trigger line. The volume indicator remains above its positive trigger line but this indicator is often a lagging indicator at market tops. Putting it all together the long term rating remains BULLISH.
INTERMEDIATE TERM
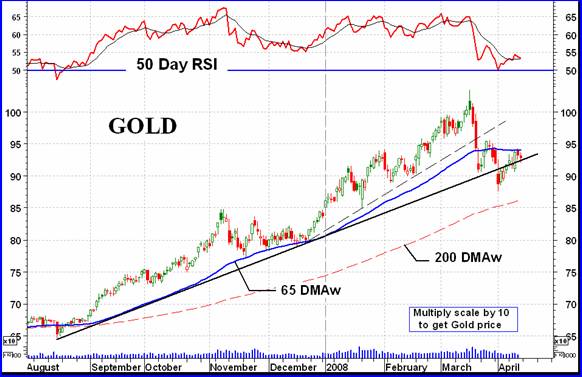
Shown on the chart is the third FAN trend line (solid black) of the FAN shown a few weeks back. Also shown is the rare fourth FAN trend line. Both have now been broken for a signal that the sharp price rise is over for now. Although the price action has moved slightly above the FAN trend line when the chart is drawn in semi-log scale it is slightly below. However, I still consider the trend broken.
The momentum indicator bounced off its neutral line but the bounce was not very strong. However the indicator did move above its trigger line but the trigger has remained slightly negative. With the Index still below its negative sloping moving average line the intermediate term rating remains BEARISH.
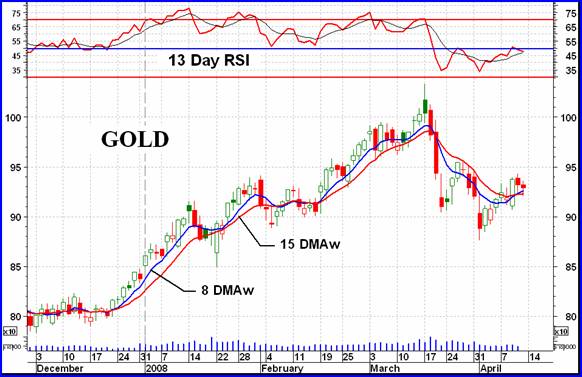
SHORT TERM
Although the short term looks like it may want to move lower the price has moved above its positive moving average line. The momentum indicator remains just above its positive trigger line but just below its neutral line in the negative zone. The short term rating has now turned into a BULLISH rating but is in a very precarious position and could change back to the bearish very quickly.
SILVER
Silver remains above its FAN trend line from the August low but has broken below the trend line from the Dec low, similar to the gold action. Nothing new happening in silver so I think I'll wait till next week for a better analysis.
Merv's Precious Metals Indices Table
Let's call it another week.
By Merv Burak, CMT
Hudson Aero/Systems Inc.
Technical Information Group
for Merv's Precious Metals Central
Web: www.themarkettraders.com
e-mail: merv@themarkettraders.com
Before you invest, Always check your market tirming with a Qualified Professional Market Technician
For DAILY Uranium stock commentary and WEEKLY Uranium market update check out my new Technically Uranium with Merv blog at www.techuranium.blogspot.com .
During the day Merv practices his engineering profession as a Consulting Aerospace Engineer. Once the sun goes down and night descends upon the earth Merv dons his other hat as a Chartered Market Technician ( CMT ) and tries to decipher what's going on in the securities markets. As an underground surveyor in the gold mines of Canada 's Northwest Territories in his youth, Merv has a soft spot for the gold industry and has developed several Gold Indices reflecting different aspects of the industry. As a basically lazy individual Merv's driving focus is to KEEP IT SIMPLE .
To find out more about Merv's various Gold Indices and component stocks, please visit www.themarkettraders.com and click on Merv's Precious Metals Central . There you will find samples of the Indices and their component stocks plus other publications of interest to gold investors. While at the themarkettraders.com web site please take the time to check out the Energy Central site and the various Merv's Energy Tables for the most comprehensive survey of energy stocks on the internet. Before you invest, Always check your market timing with a Qualified Professional Market Technician
Merv Burak Archive |
© 2005-2022 http://www.MarketOracle.co.uk - The Market Oracle is a FREE Daily Financial Markets Analysis & Forecasting online publication.