How to Trade in Currency Markets with Harmonic Chart Patterns
InvestorEducation / Technical Analysis Nov 14, 2013 - 10:13 AM GMTBy: Submissions
 Brett Chatz writes: One of the biggest challenges facing traders in the currency market is that of identifying future patterns or trends which may develop. Fortunately, some pretty useful methods have been developed using technical analysis and fundamental analysis. No method is fool proof and no method provides 100% certainty as to future market movements. However in the trading arena, it’s probabilities that investors are looking for. The higher the probability that an event is likely to occur the better.
One such method of interpreting financial data is that of geometric price patterns. Of paramount importance are the turning points in currency trading between major currency pairs – of which there are 6. Fibonacci numbers are now widely used with harmonic trading to ascertain future prices. For the most part, the methods currently in use today tend to react to market events as opposed to predicting them.

Volatile FX Markets are the Norm
The current uncertainty in international markets continues unabated. The volatility of currency trading has ironically become a staple of the currency market, and as such is the norm. There are fundamentals that drive currency markets, such as labour force participation rate, unemployment rates, interest rates, GNP, GDP, market performance and other announcements made by major market players including the Chairman of the Federal Reserve Bank.
Other issues that affect currency markets include bailouts and austerity measures in the Euro Zone, natural disasters such as the recent typhoon in the Philippines, and the inherent problems that have hamstrung the US economy with the rollout of the Affordable Care Act. Each of these triggers and many more can have dramatic effects on the relative strengths and weaknesses of currency pairs. Harmonic patterns attempt to anticipate market occurrences, for the benefit of traders.

Geometric Sequences and Primary Ratios
Let us assume that - thanks to Scott Carney - Fibonacci numbers and geometry can combine to provide very useful information. We start with the primary ratio 0.618. The ratios which complement this will include the following set of numbers: 0.382 & 0.50 & 1.41 & 2.0 & 2.24 & 2.618 & 3.14 & 3.618. Interestingly enough, the aforementioned primary ratio occurs naturally in the environment. It is inherent in the buildings we work in, the houses we sleep in, the vehicles we drive, the bridges we navigate and most everything else. The important point is that this ratio is evident in the world's financial markets too. The goal of course is to uncover all the intricate patterns that exist and then apply the Fibonacci ratios to anticipate future market movements. Don't forget that we working with a very accurate price mechanism with harmonic pricing. Even though you may at times notice a pattern that you may believe is a harmonic pattern, the Fibonacci level will render the patterns unreliable according to this approach. This has the effect of requiring traders to carefully examine the financial data prior to making potentially risky investment decisions. Your financial savvy will be tested because many non-harmonic patterns will come up too.
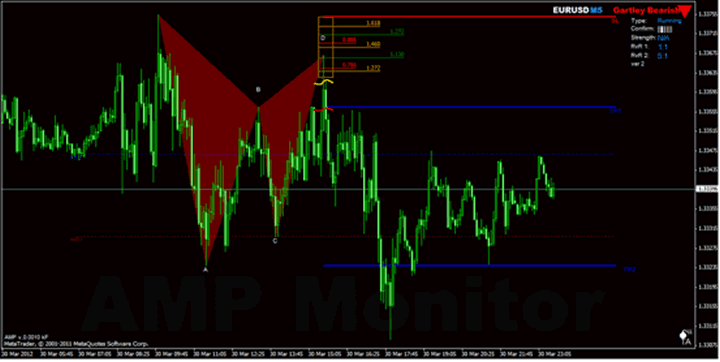
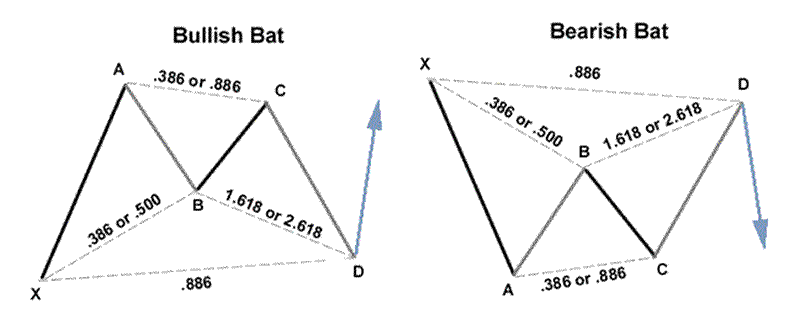
From a strictly visual perspective, there appear to be at least 4 popular harmonic patterns. These include the Crab Pattern, the Bat Pattern, the Gartley Pattern and the Butterfly Pattern. Each of these patterns provides information to traders with important reversal zones indicated. This price reversal zone (PRZ) has 2 measurements. These extensions are used to project price levels allowing traders to enter a position within a few pips. Of course, you'll have to brush up on your mathematics before you use harmonic trading. Harmonic trading is not an endeavour that should be entered into willy-nilly. It requires lots of practice and study. As mentioned earlier, many times you will observe what appears to be a harmonic pattern, only to find that the Fibonacci sequence disqualifies it as such. That's why it's vital to use the more well-known patterns – the 4 mentioned above – to determine the price reversal zone.

Using Harmonic Patterns in FX Trading
Once you have recognized the existence of a harmonic pattern in a currency pair, you can rest assured that the likelihood that a turning point has been reached is very strong. This will allow you to act decisively by shorting a currency or going long on a currency, as reflected by the pattern. Remember, based on the above diagrams, a bullish pattern will have a market turning point that moves upwards requiring you to go long on the currency. A bearish pattern will have a market turning point (designated by point D) that is negative and moves downward. This requires you to act decisively and go short on the currency. Seen in this way, if you have the right software to identify harmonic patterns in your currency trading endeavours, you can quickly and easily use Fibonacci and geometry for financial gain. At all times, it's important to carefully select the currency pairs that you will be trading and also the market trading times that you will be looking to generate returns.
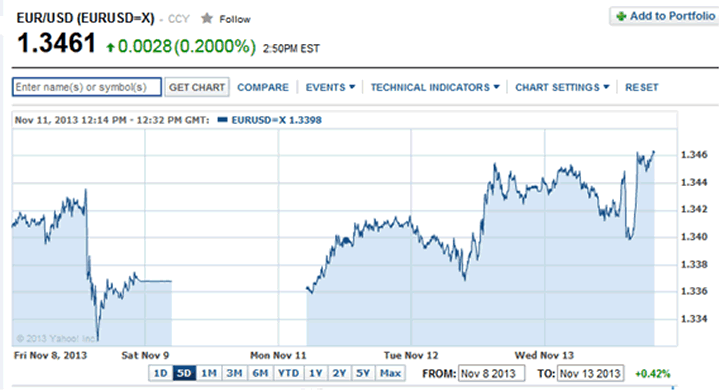
Recent market news showed strong gains for the British pound as unemployment figures improved during the last quarter. The British pound has been rallying on the back of positive figures released by the International Labour Organization. In Europe, the ECB (European Central Bank) does not look set to take up quantitative easing and this has resulted in a strengthening of the euro against the US dollar. Allied with that, is the low inflation in Europe at .70%. This news presents currency traders with opportunities to apply harmonic patterns for profit potential.
By Brett Chatz
http://spreadbettingreview.co.uk/
© 2013 Copyright Brett Chatz - All Rights Reserved Disclaimer: The above is a matter of opinion provided for general information purposes only and is not intended as investment advice. Information and analysis above are derived from sources and utilising methods believed to be reliable, but we cannot accept responsibility for any losses you may incur as a result of this analysis. Individuals should consult with their personal financial advisors.
© 2005-2022 http://www.MarketOracle.co.uk - The Market Oracle is a FREE Daily Financial Markets Analysis & Forecasting online publication.


