


Can The Fed Prevent A Stock Market Crash In 2014?
Stock-Markets / Stock Markets 2014 Nov 07, 2013 - 06:46 PM GMTBy: Clif_Droke

 Two questions that I'm commonly asked are: "Do you still expect the market to correct next year, even with all this liquidity?" And, "Can the Fed mute the effects of the cycles bottoming in October 2014?"
The first question can only be answered provisionally. If the stock market melts up heading into 2014, the odds of a crash will increase dramatically at some point before the Kress cycle bottoms toward the end of the year. The market has certainly shown signs that investor optimism is increasing on Wall Street, even if small retail traders haven't quite yet joined in on the exuberance.
There are already a growing number of indications that investor optimism is reaching climactic levels among the pros, a trend that will likely only grow heading into 2014. Should this continue it's something that could exacerbate a market correction next year. As an example, Yahoo Finance recently published an article entitled, "The Next 10% Correction Could Be 5 Years Away" by Jon Markman of Markman Capital Insight LLC, an advisory service in Seattle. Markman wrote:
"There has been a lot of concern that stocks have gone too far lately without a 10% correction. The fear is that, if the market goes on too long without losing at least a tenth of its value off a high, any pullbacks to come in the future will be a lot more dramatic.
"The analysts over at Bespoke Investment Group took a look at that question this week and came up with an interesting study. They observed that the S&P 500 has now rallied 59% over a period of 515 trading days since Oct. 3, 2011, without logging a 10% decline from a high. And while it is certainly unusual, it is by no means unprecedented, or even close to the longest such streak."
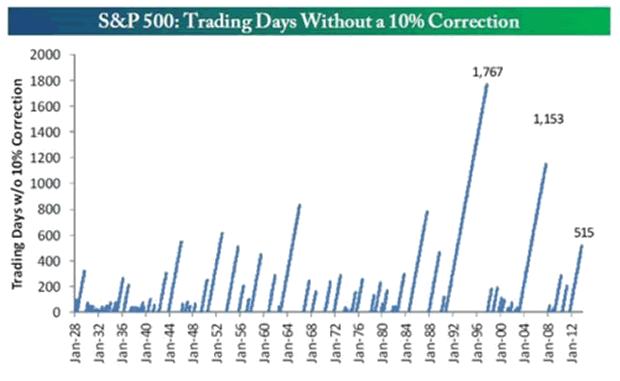
The above graph, created by Bespoke, shows all past rallies without a 10% correction since the index was created in 1928. The current streak of 515 days is well above average, but the article emphasized that there have been two periods over the past 25 years that were more than twice as long: the first was from March 2003 to October 2007 (the length of the previous bull market). The S&P 500 went 1,153 trading days without experiencing a 10% correction, according to Bespoke. The longest streak on record was from October 1990 through October 1997, a total of 1,767 trading days.
"The current streak would have to extend all the way out to Oct. 1, 2018 -- five years from now -- to match that record," Markman observed. He concluded that "as long as a low-growth environment also features low inflation and an accommodative monetary policy, the price/earnings multiples of successful companies can rise a lot higher than most people think."
Articles like this one are commonly seen near major highs in the major indices. As such, they can be viewed from a contrarian perspective which suggests this rally is living on borrowed time.
As far as the Fed, I think it's safe to say it has already provided enough liquidity to prevent a 2008-type "super crash" scenario in 2014. This will eventually backfire, however, once the 120-year cycle bottoms next year and a new inflation cycle begins. In other words, inflation will likely be the next problem in the years following 2014, as we'll discuss in the paragraphs that follow.
30-Year Cycle
As the final months of the long-term deflationary winter wind down, our thoughts keep turning to the coming spring of a new 30-year inflationary cycle. This cycle is set to begin after the late September/early October 2014 period based on the methodology of the Kress cycles.
For a picture of what will likely happen in the U.S. in the coming years, look no further than Japan. The income gap is widening and the difference between the haves and the have-nots has never been more conspicuous. The monetary policy of Japan's Prime Minister, Shinzo Abe, are the driving force between this gap.
Deflation was a blessing in disguise for consumers in Japan, but the blessing of deflation is now being replaced by the curse of inflation. Deflation was especially beneficial for the country's aging population for some 20 years as low consumer prices helped the elderly and underemployed get by during times when the economy was sluggish. With the advent of Abenomics, however, Japan is finally starting to see signs of inflation after more than 20 years of falling prices.
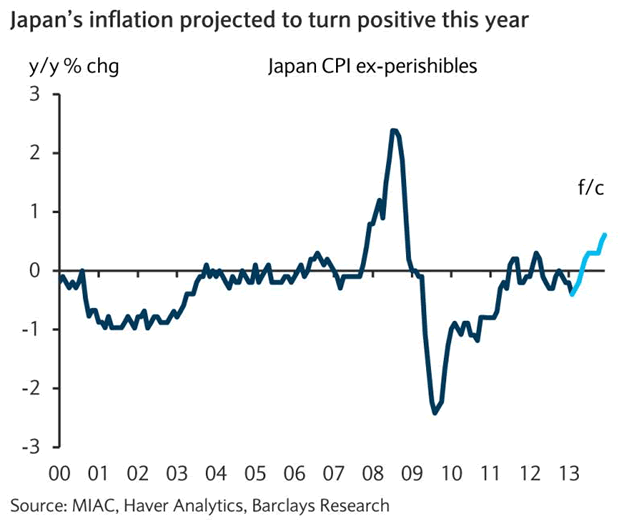
Consumer prices increased 0.8 percent in August compared to a year ago, the fastest pace since November 2008 according to Bloomberg Businessweek. Economists expect that Japan's inflation could rise 2.8 percent in 2014 due to a sales tax increase. Barclays correctly predicted Japan's inflation rate would rise earlier this year (see graph below from the International Business Times). That rate is only expected to increase in the coming years.
Bloomberg also points out that land prices in Japan's three largest cities - Tokyo, Osaka, and Nagoya - rose for the first time in five years. Mizuho Securities real estate analyst Takashi Ishizawa believes land prices will continue to rise in the larger cities, where rents will also expected to increase.
To help households cope with the growing problem of inflation, Prime Minister Abe is encouraging companies to raise wages. The problem is that wages aren't cooperating: they fell 0.6 percent in August from a year ago, keeping a 15-month downward trend intact. This is another point of contention for the U.S., for the coming long-wave inflationary cycle could be much more malicious than the previous one that ended around 1980. At that time wages were rising along with prices and interest rates, which made it easier for consumers to absorb the price increases. The coming inflationary cycle could witness a continuation of the stagnant-to-falling wage trend as prices and rates rise. This would be positively catastrophic for America's middle class.
As I pointed out in the previous commentary, Japan was the first major nation to feel the effects of the long-term deflationary cycle and is also first to emerge from the long-wave deflationary winter. What is now happening to Japan is instructive, for it will also happen to the U.S. once the cycle has bottomed next year.
The growing income disparity in Japan is being exaggerated by Abe's ultra-loose monetary policy and has already become evident. While the country's upper-middle class wage earners are enjoying its benefits through the proceeds of their stock investments, lower-income earners are struggling to make ends meet. Prices are rising and with it the cost of living, which is squeezing workers at the margins.
To put Japan's economic picture into perspective, the average income of the country's richest 10 percent is 4.5 times higher than the lowest 10 percent, according to the United Nations' 2007-2008 Human Development Report. By contrast, the gap between the richest in the U.S. is 15.9 times higher than the poorest and 13.8 in the U.K. This gap is expected to widen in the coming years once the new long-term inflationary cycle kicks into full gear.
Banks and governments never seem to learn from history that refusing to let the cycles take their natural course can only create greater problems down the road. Unfortunately, America seems doomed to learn this lesson the hard way.
Stock Market Cycles
Take a journey with me as we uncover the yearly Kress cycles - the keys to unlocking long-term stock price movement and economic performance. The book The Stock Market Cycles covers each one of the yearly cycles in the Kress Cycle series, starting with the 2-year cycle and ending with the 120-year Grand Super Cycle.
The book also covers the K Wave and the effects of long-term inflation/deflation that these cycles exert over stock prices and the economy. Each chapter contains illustrations that show exactly how the yearly cycles influenced stock market performance and explains where the peaks and troughs of each cycle are located and how the cycles can predict future market and economic performance. Also described in this original book is how the Kress Cycles influence popular culture and political trends, as well as why wars are started and when they can be expected based on the Kress Cycle time line.
Order today and receive an autographed copy along with a copy of the booklet, "The Best Long-Term Moving Averages." Your order also includes a FREE 1-month trial subscription to the Gold & Silver Stock Report newsletter:
http://clifdroke.com/books/Stock_Market.html
By Clif Droke
www.clifdroke.com
Clif Droke is the editor of the daily Gold & Silver Stock Report. Published daily since 2002, the report provides forecasts and analysis of the leading gold, silver, uranium and energy stocks from a short-term technical standpoint. He is also the author of numerous books, including 'How to Read Chart Patterns for Greater Profits.' For more information visit www.clifdroke.com
Clif Droke Archive |
© 2005-2022 http://www.MarketOracle.co.uk - The Market Oracle is a FREE Daily Financial Markets Analysis & Forecasting online publication.