


Explaining Amazon's Stock Price Performance
Companies / Tech Stocks Nov 05, 2013 - 06:55 AM GMT

 Amazon (AMZN) is a stock that seems to defy conventional wisdom about how a stock is, or should be, valued. Fundamental investors, like yours truly, recognize and respect the importance of the earnings and price relationship. Moreover, I will be so bold as to emphatically state that in the long run profitability (earnings) will be the primary determinant of a businesses' fair value, any business. However, my bold statement is predicated on the longer run. In the short run it is often a truth that all bets are off.
This leads me to a few words about market efficiency. Academics supportive of modern finance theory argue for an efficient market hypothesis (EMH). Investopedia offers the following definition of the Efficient Market Hypothesis (emphasis added mine):
"An investment theory that states it is impossible to "beat the market" because stock market efficiency causes existing share prices to always incorporate and reflect all relevant information. According to the EMH, stocks always trade at their fair value on stock exchanges, making it impossible for investors to either purchase undervalued stocks or sell stocks for inflated prices. As such, it should be impossible to outperform the overall market through expert stock selection or market timing, and that the only way an investor can possibly obtain higher returns is by purchasing riskier investments."
The primary reason I am sharing the above information as well as this article on Amazon and its inexplicable stock valuation is based on two comments I received in my last article. The first comment came in the form of a question: how do you explain Amazon? The second comment that inspired me further was "Market is never wrong. Never fight the market." Although I think the second comment was offered tongue-in-cheek, at least I hope it was, both comments inspired me to write this article. Frankly, I have to side with Warren Buffett who once said "I'd be a bum on the street with a tin cup if the markets were always efficient."
My own view of the efficiency of markets is somewhat different than the views promulgated today in so-called modern finance theory. Instead of asserting that the market is all-knowing and/or incorporating and reflecting all relevant information, I contend instead that it is constantly seeking efficiency, but not necessarily efficiently pricing stocks at any point in time. In other words, I believe that the market will often incorrectly price a company's stock from time to time based on either inaccurate information and/or emotionally charged thinking.
However, since there is so much volatility with stock price action on an hourly, daily, weekly, monthly and annual basis, it also seems logical to me that the market may in truth be always seeking efficiency, but clearly not always efficiently pricing stocks. Therefore, when more accurate information (the truth) inevitably manifests, or when fear or greed subsides, then stock price will inevitably reflect true value based on a company's profitability (earnings). Sometimes this process is quite frustrating because it takes a long time to adjust, and other times it can be swift and brutal. But in the end, fair value does and will prevail.
The Difference Between Investing and Speculating (Gambling)
To understand this more clearly, it's important to recognize the difference between investing and speculating in stocks or the stock market. Investors are interested in being shareholder partners in a wonderful business. The primary factor that makes a business wonderful is how profitable it is today and how profitable it will be in the future. Positioned as owners, investors possess both the desire and penchant for long-term ownership. But most importantly, their primary focus is on the fundamentals underlying the business they own.
In contrast, speculators tend to be much more short-term oriented. Instead of focusing on the business, they are primarily interested in the price movement of the stock. Speculators are typically comprised of traders, who might only be interested in owning the stock for a few days, months or even hours. Traders focus on metrics such as momentum, 50-day moving averages, money flows, short interest and other factors that they believe might have an effect on the stock's near-term movement.
At this point, it's important for me to clarify that what I am discussing in this section is not a value judgment. In other words, I'm not suggesting that investing is better than speculating or vice versa. Instead, I am merely pointing out and stating that they are entirely different behaviors. And as such, require a different thought process depending on which type of individual you are, or which strategy you prefer. Personally, I tend to favor the investing strategy over speculation. On the other hand, I am very appreciative and thankful that speculators and traders exist.
Because, if it were not for speculators and traders, we would lose the tremendous benefit and advantage of the liquidity they provide. Thanks to traders and speculators, there is always a market that is willing to buy or sell a wonderful business (or even one that is not so wonderful) that I and other investors are interested in. As an aside, I intend to write future articles discussing the relevance and importance of liquidity as it relates to investing in publicly traded stocks. But for now, my interest is in pointing out that investors and speculators will naturally possess different mindsets as they execute their respective strategies. Therefore, I contend that it's crucial for you understand which type you are.
The Two Faces of a Publicly Traded Company
In the context of what I wrote in the previous section, it logically follows that every publicly traded company has two faces. One face is the business behind the stock. When thinking about the business, the vital metrics are all, and should be, fundamentals. As a business owner I am concerned with metrics such as cash flows, earnings, the balance sheet and of course the validity and future prospects of the products and services that my business provides. Therefore, my most important considerations and the most important question that I should ask and answer is-how's business?
The other face of a publicly traded company is its stock price and how it is behaving in the market over both long and short periods of time. Since traders and speculators primarily focused on price movement, they often have little interest or concern about fundamentals. This partially explains how and why the market can often dramatically improperly appraise the true value of the business as reflected by its current stock price.
Although I have not conducted a formal study on this behavior, anecdotal evidence amassed over more than 40 years experience and observation leads me to the following conclusions. In the eyes of many, if the price of a given company is rising it is considered a good stock no matter what fundamentals would dictate. In contrast, if the price of a given company has been weak or falling, then it is a bad stock, again, independent of what fundamentals might suggest. Consequently, if someone, like yours truly, attempts to point out excessive valuation, the message is often received with great protest and even persecution.
Moreover, studies on behavioral finance report that people feel the pain of loss 2 ½ times greater than they do the pleasure of gain. This aspect of human behavior creates a couple of potentially serious problems. A rising stock price tends to inspire overconfidence while a falling stock price instigates fear and panic. These emotional responses often cause people to buy when a stock's valuation is high (greed kicks in), and sell when the stock's valuation is low (fear). Logic would dictate this behavior to be precisely the opposite of what it should be. However, and unfortunately, trying to argue or present a case when emotions are charged is often an exercise in futility. Moreover, even prestigious professional researchers seem to have fallen under Amazon's spell as evidenced by the following excerpts from recent research reports. Take special note of how these prominent research shops recognize the high valuation on Amazon stock, yet seem oblivious to the risk it presents:
"Amazon Research Notes
Zacks
Amazon shares are trading at a huge P/E multiple, so a valuation based on P/E may not be meaningful. However, it is also trading at the high end of the historical range based on P/B. Its expected earnings growth rate of over 29% over the next five years is much higher than both the peer group and the S&P 500, indicating that the premium valuation is justified."
"Benchmark
We believe Amazon continues to put out the best "bang for your buck" tablet, which we think is helping drive accelerating Prime adoption, particularly as original Instant Video content comes online. We reiterate our belief that Amazon is still in the very early stages of international development, with 2Q's NA reacceleration possibly translating to international as digital infrastructure and physical offerings come available to a wider audience. Furthermore, we see consistent margin expansion continuing through at least 2014, helping support Amazon's seemingly lofty valuation."
It's Hard To Argue With Amazon's Performance - But In Good Conscience I Must
Consequently, I believe that Amazon may represent a stock that currently inspires overconfidence. Moreover, by saying that, I also acknowledge the spectacular performance Amazon has provided shareholders over the past 5 years.
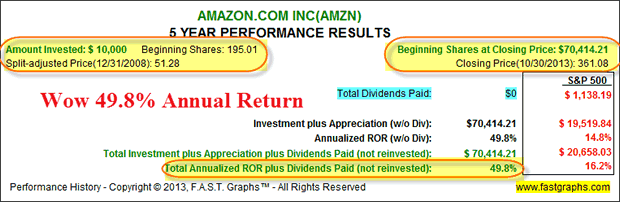
However, this spectacular performance is in spite of the fact that it has achieved negative earnings growth and pays no dividends.
A Contrarian View on Amazon's Valuation
On the other hand, and to present a balanced view on what other prestigious professional research firms are reporting, I offer an excerpt from a report By Hibah Yousuf ;@CNNMoneyInvest October 29, 2013: 10:18 AM ET:
"Here is a look at where StarMine thinks some of the market's hottest stocks should be trading.
Amazon.com (AMZN, Fortune 500) Current price: $358.16 StarMine target: $37.65
Amazon.com's stock has climbed more than 40% this year to a record high of nearly $370 a share. According to StarMine analysts, that's almost 10 times higher than where the price should be and makes it the most overvalued stock in the S&P 500.
In fact, to justify its current value, Amazon would need earnings to grow at a compounded rate of 55% annually for the next decade, according to Thomson Reuters corporate earnings research analyst Greg Harrison. "That's almost unheard of for a company the size of Amazon," he said, adding that Wall Street analysts are projecting an annual 10-year earnings growth rate of 22%. "
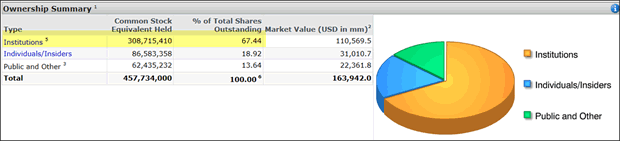
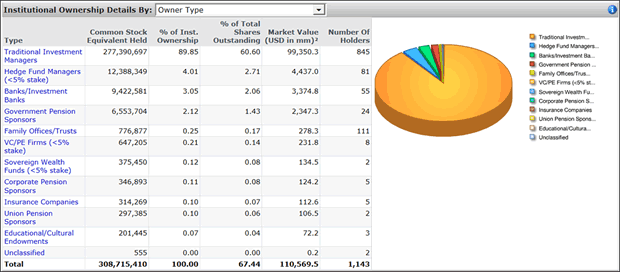
Should Amazon's Shareholders Be Worried About Institutional Ownership?
Through the process of researching Amazon for this article I came across some additional information that I believe might be, or at least should be, of some concern to Amazon shareholders. If not concern, I believe that shareholders of Amazon should at least be aware of the high institutional ownership. Institutions can be a fickle lot. Therefore, as long as they stay positive and hold their shares, the stock might continue to do well over the short run. However, I believe the following two graphics taken from Standard & Poor's Capital IQ indicate a reason for caution:
Amazon's Amazing Stock Levitation Magic Trick
I've been analyzing common stocks for the better part of five decades, and I've never come across a stock that was more amazing and befuddling at the same time than Amazon. After going public in May of 1997, the company did not generate a dime's worth of earnings until 2004.
Then, from 2004 to 2010, Amazon grew earnings at a staggering compound annual growth rate of 55%. Moreover, during that timeframe, Amazon's stock price closely correlated to and tracked their earnings growth. This all made sense, and was as it should have been. Great earnings generation produced a powerful advance of their stock price, and all was well with the world. The following earnings and price correlated F.A.S.T. Graphs™ presents a graphic depiction of Amazon's earnings and price correlated record from 2004 to 2010.
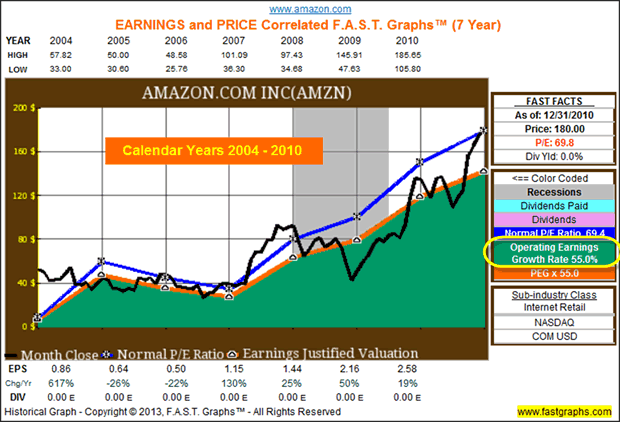
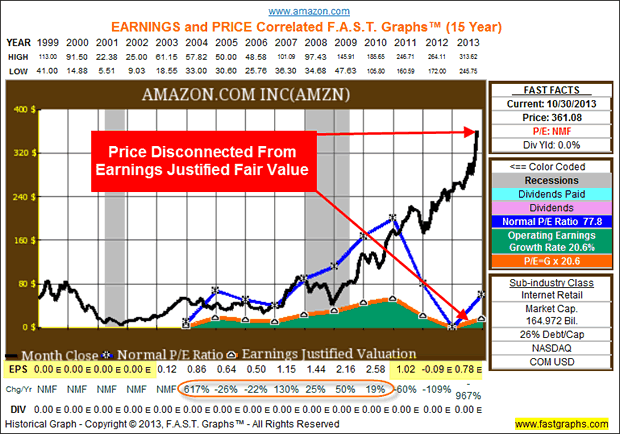
Perhaps it was during the glory days of profit growth where Amazon first created its loyal, if not overzealous followers. However, since 2010, Amazon has found it difficult, if not impossible, to bring any profits down to the bottom line. But this has not stopped their stock price from continuing to advance to stratospheric levels based on earnings. A quick glance at the earnings and price correlated F.A.S.T. Graphs™ below presents and summarizes in graphic form what I discussed so far. To me, the most startling aspect of the following graphic is how Amazon's stock price has continued to advance like a rocket ship headed to the moon, in spite of collapsing earnings in 2011 and 2012. Could there be something that I am missing?
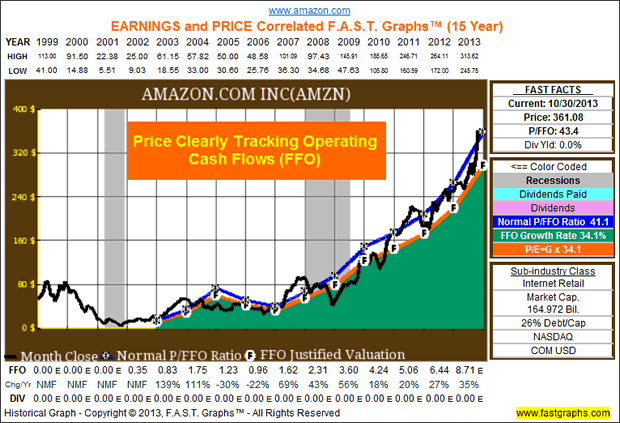
In order to see if I had missed anything, I took a look at Amazon based on a calculation of Funds From Operations (FFO), which is a very close cousin to operating cash flows, and what I discovered was Amazon amazing. Amazon's stock price tracked FFO almost perfectly as depicted below. However, this still befuddles me, because even though Amazon is clearly generating very strong cash flows, investors should consider that none of these cash flows are available to them. Here is a link to the formula utilized to calculate Amazon's FFO directly from their Statement of Cash Flows/ Statement of Changes.
Therefore, based on what the following funds from operations (FFO) and price correlated graph reveals, Amazon stock price has been clearly tracking cash flows. Frankly, I found this to be the most compelling reason, or perhaps justification, for how I could explain Amazon's strong returns. With no regard for profits, Amazon stock is trading on cash flows.
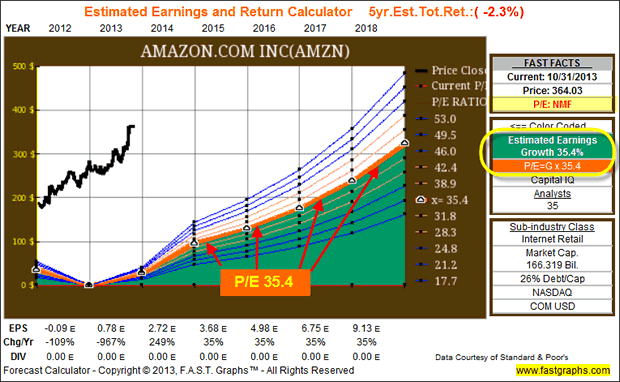
Another plausible explanation for Amazon's stratospheric stock valuation might be expectations of future earnings growth. The following "Estimated Earnings and Return Calculator" is based on the consensus of 35 analysts reporting to Standard & Poor's Capital IQ. These 35 analysts forecast that Amazon will grow future earnings at a rate of 35.4% per annum over the next five years, a very large and attractive growth rate.
When you consider that the dark orange line on that graph represents a P/E ratio of 35.4, Amazon's current P/E ratio is too high to calculate, therefore, it is designated on the FAST Graph in the FAST FACTS box as no meaningful figure (NMF), you get an immediate perspective of how frothy Amazon's share price currently is. Sure, expectations for future earnings growth are staggeringly high, but even at that enormous rate of growth, future earnings would not support Amazon's stock price and high valuation.
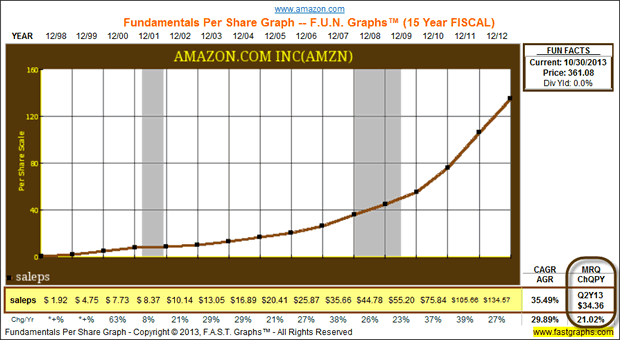
Therefore, I continued to look for positives that might justify Amazon's lofty valuation and turned to sales. The following FUN (fundamental underlying numbers) graph plots Amazon's sales per share since 1998. Sales per share (saleps) increased from $1.92 per share at fiscal year-end 1998 to $134.57 per share by fiscal year-end 2012. During their most recent quarter (MRQ) sales per share were $34.36. If you simply annualized that number by multiplying by four, you would get a potential 2013 sales per share of $137.44, indicating continuing strong sales growth. Any owner of a business accomplishing that great feat would be happy.
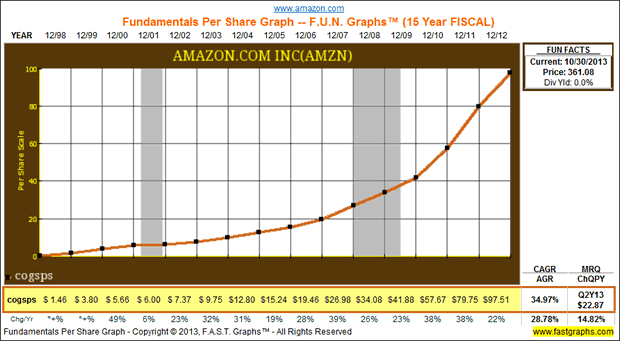
On the other hand, Amazon's cost of goods sold per share (cogsps), have also increased at a staggering rate. Cost of goods sold per share increased from $1.46 in fiscal year-end 1998 to $97.51 by fiscal year-end 2012. This represented a 34.97% compound annual growth rate on cost of goods sold per share. Clearly, it keeps getting more expensive for Amazon to grow their business.
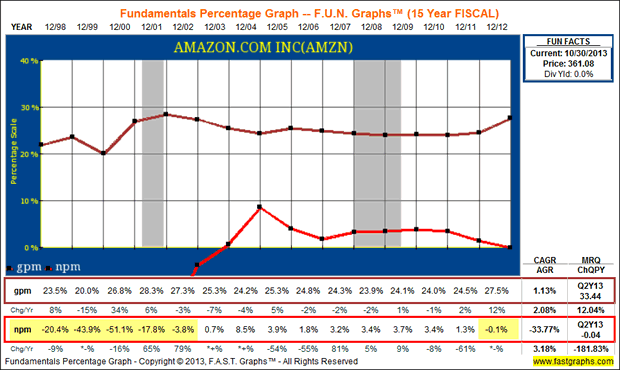
So next I turned to looking at gross profit margin (gpm) and found that Amazon was generating gross margins of 27.5% by fiscal year-end 2012, and 33.44% for their most recent quarter. These are good numbers for any business. However, when I looked at net profit margin (npm), I discovered a negative number for 2012 and a negative profit margin for the most recent quarter. Moreover, I discovered that for most of its operating history, Amazon has often generated negative profit margins, not a good thing in my book.
This begs the question-Why can't Amazon bring their strong sales to the bottom line? To me this is a big negative, because as a shareholder, all I could ever expect to be rewarded with must come from earnings and/or dividends. Amazon does not seem capable of generating either, in spite of their enormous sales success. To me this is quite troubling.
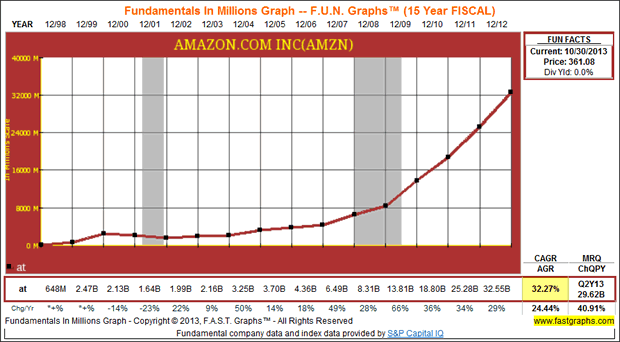
After evaluating margin, I turned to looking at assets and asset growth. Once again, I found extraordinary results. Amazon increased their total assets from $648 million in fiscal year-end 1998 to $32.55 billion by fiscal year-end 2012. That represents a compound annual growth rate of assets of over 32.27% per annum.
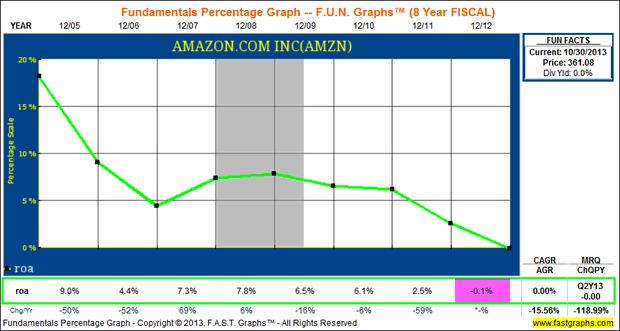
On the other hand, even though Amazon has grown assets at a staggering rate, they don't seem to be capable of earning any returns on those same assets. The following graph shows Amazon's return on assets since fiscal 2005. I feel it's a disturbing trend to see that Amazon's returns on assets have been steadily on the decline and even turned negative in fiscal 2012.
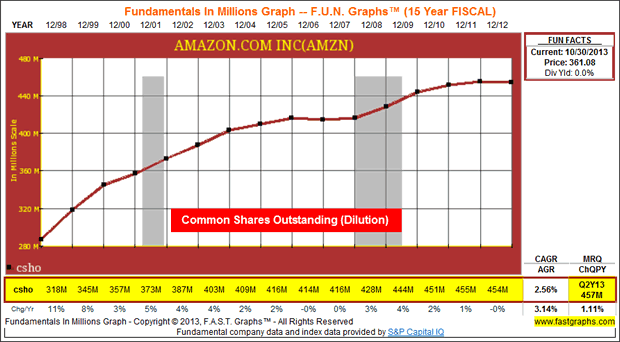
Although Amazon's asset growth has been extreme, so have their common shares outstanding (csho). Common shares outstanding have increased from 318 million shares in fiscal 1998 to 454 million shares by fiscal year-end 2012. Typically this type of dilution would cause stock price to fall, not rise. Moreover, a rising share count makes it more and more difficult to generate earnings growth, which may partially explain why Amazon has not.
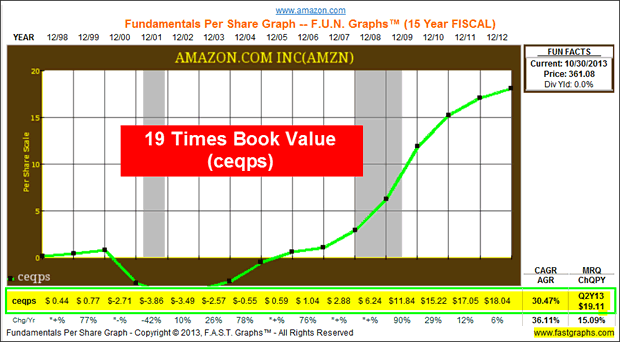
Then I thought, let's take a look at common equity or book value. Here once again I see a very positive result and trend. Common equity per share has increased from $.44 per share in fiscal 1998 to $18.04 per share by fiscal 2012. Once again I discovered a compound annual growth rate exceeding 30% per annum, sweet. On the other hand, with a share price at over $361 per share, Amazon is trading at approximately 19 times book value, pretty rich.
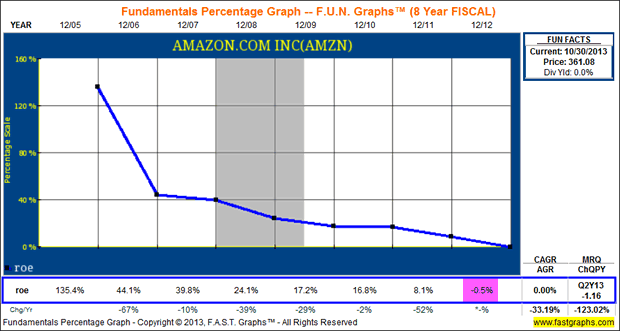
But when I looked at return on equity (roe), I once again saw a disturbing trend and numbers. Return on equity fell from 134.5% in fiscal 2005 to a negative number by fiscal year-end 2012.
Summary and Conclusions on Amazon's Valuation
Amazon is clearly a powerful company that possesses many significant and powerful fundamental attributes. On the other hand, I find it quite disturbing that the company cannot seem to bring their sales success to the bottom line. I have to believe that at some point investors are going to demand that Amazon not only starts delivering some profits, but perhaps some dividends along the way as well. If not, then I believe that Amazon's stock price is very vulnerable to a large drop. My point being that Amazon's shareholders should at least be aware of the extreme valuation on their shares. If the magic trick that's levitating their shares dissipates, the results could be devastating.
In closing, Amazon's stock reminds me of the game of musical chairs. As long as the tune of irrational exuberance continues to play, then shareholders dancing around Amazon's highly valued shares can continue to enjoy the siren song of extreme optimism. But I feel it's only prudent to recognize and report the facts about how I explain Amazon's stock performance. Caveat emptor.
Disclosure: No positions at the time of writing.
By Chuck Carnevale
Charles (Chuck) C. Carnevale is the creator of F.A.S.T. Graphs™. Chuck is also co-founder of an investment management firm. He has been working in the securities industry since 1970: he has been a partner with a private NYSE member firm, the President of a NASD firm, Vice President and Regional Marketing Director for a major AMEX listed company, and an Associate Vice President and Investment Consulting Services Coordinator for a major NYSE member firm. Prior to forming his own investment firm, he was a partner in a 30-year-old established registered investment advisory in Tampa, Florida. Chuck holds a Bachelor of Science in Economics and Finance from the University of Tampa. Chuck is a sought-after public speaker who is very passionate about spreading the critical message of prudence in money management. Chuck is a Veteran of the Vietnam War and was awarded both the Bronze Star and the Vietnam Honor Medal.
© 2013 Copyright Charles (Chuck) C. Carnevale - All Rights Reserved Disclaimer: The above is a matter of opinion provided for general information purposes only and is not intended as investment advice. Information and analysis above are derived from sources and utilising methods believed to be reliable, but we cannot accept responsibility for any losses you may incur as a result of this analysis. Individuals should consult with their personal financial advisors.
Chuck Carnevale Archive |
© 2005-2022 http://www.MarketOracle.co.uk - The Market Oracle is a FREE Daily Financial Markets Analysis & Forecasting online publication.