Large Forex Speculators Were Bearish on US Dollar Into Late October Bottom, COT Report
Currencies / Forex Trading Nov 03, 2013 - 04:02 PM GMTBy: CountingPips
 The latest data for the weekly Commitments of Traders (COT) report was released on Friday by the Commodity Futures Trading Commission (CFTC) and showed that large futures speculators turned bearish on the US dollar on October 8th and then registered three straight weeks of bearish positions through October 22nd.
Non-commercial large futures traders, including hedge funds and large International Monetary Market speculators, had an overall US dollar short position totaling $-3.64 billion as of Tuesday October 22nd. This was a weekly change of $-2.4 billion from the total position of $-1.24 billion that was registered on October 15th, according to data from Reuters that calculates this amount by the total of US dollar contracts against the combined contracts of the euro, British pound, Japanese yen, Australian dollar, Canadian dollar and the Swiss franc.
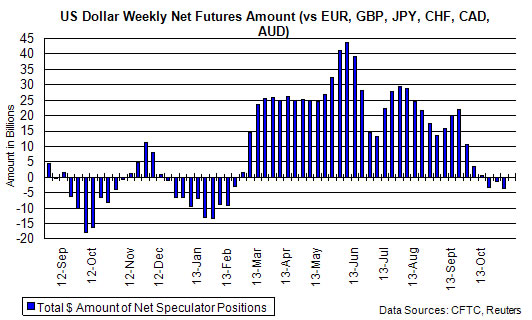
US dollar positions, on October 22nd, were at a new lowest level since February 5th when US dollar bets were short at a total of $-9.15 billion.
This latest batch of data, three weeks worth for October 8th, 15th & 22nd, is a catch up for the missed releases during the government shutdown and does not cover last week’s positions.
Individual Currencies Large Speculators Positions in Futures:
The large non-commercial net positions for each of the individual major currencies directly against the US dollar on October 22nd showed weekly increases for the euro, British pound sterling, Swiss franc, Canadian dollar, Australian dollar and the New Zealand dollar while there were declines for the Japanese yen and the Mexican peso.
Individual Currency Charts:
EuroFX:
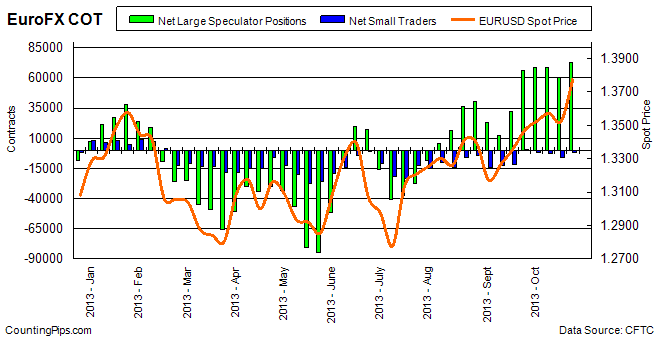
Last Six Weeks of Large Trader Positions: EuroFX
| Date | Large Trader Net Positions | Weekly Change |
| 09/17/2013 | 31907 | 19211 |
| 09/24/2013 | 65844 | 33937 |
| 10/01/2013 | 68276 | 2432 |
| 10/08/2013 | 68683 | 407 |
| 10/15/2013 | 60374 | -8309 |
| 10/22/2013 | 72434 | 12060 |
British Pound Sterling:
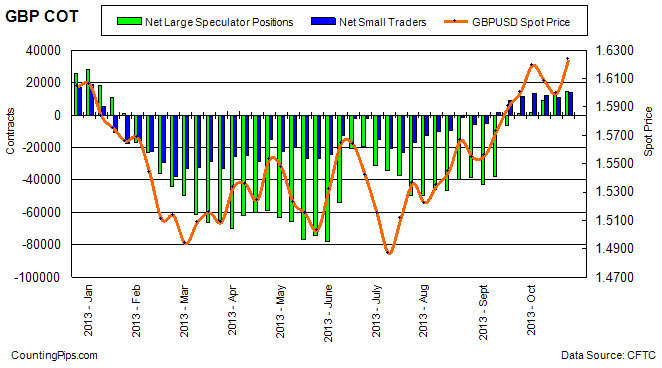
Last Six Weeks of Large Trader Positions: Pound Sterling
| Date | Lg Trader Net | Weekly Change |
| 09/17/2013 | -6310 | 31856 |
| 09/24/2013 | 1174 | 7484 |
| 10/01/2013 | 1496 | 322 |
| 10/08/2013 | 8771 | 7275 |
| 10/15/2013 | 12231 | 3460 |
| 10/22/2013 | 14262 | 2031 |
Japanese Yen:
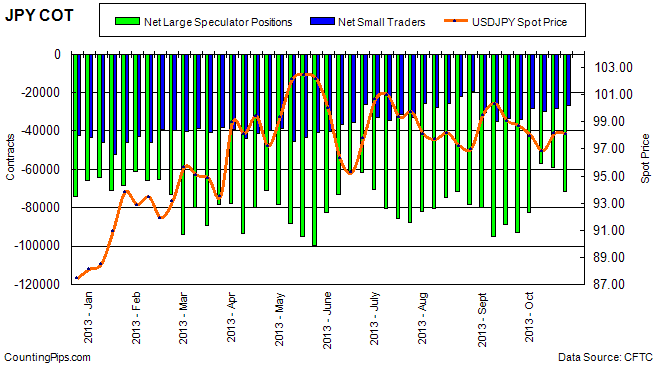
Last Six Weeks of Large Trader Positions: Yen
| Date | Lg Trader Net | Weekly Change |
| 09/17/2013 | -88794 | 6272 |
| 09/24/2013 | -92818 | -4024 |
| 10/01/2013 | -82324 | 10494 |
| 10/08/2013 | -57097 | 25227 |
| 10/15/2013 | -59266 | -2169 |
| 10/22/2013 | -71802 | -12536 |
Swiss Franc:
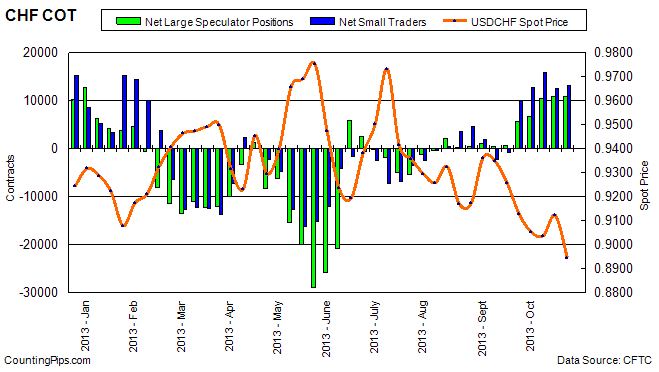
Last Six Weeks of Large Trader Positions: Franc
| Date | Lg Trader Net | Weekly Change |
| 09/17/2013 | 616 | 196 |
| 09/24/2013 | 5745 | 5129 |
| 10/01/2013 | 6636 | 891 |
| 10/08/2013 | 10415 | 3779 |
| 10/15/2013 | 10767 | 352 |
| 10/22/2013 | 10931 | 164 |
Canadian Dollar:
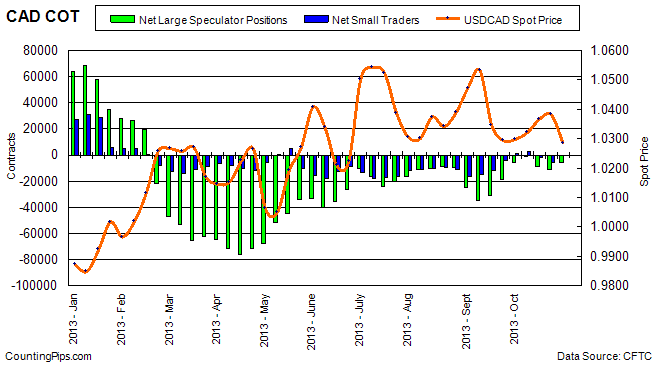
Last Six Weeks of Large Trader Positions: CAD
| Date | Lg Trader Net | Weekly Change |
| 09/17/2013 | -18764 | 12178 |
| 09/24/2013 | -5675 | 13089 |
| 10/01/2013 | -955 | 4720 |
| 10/08/2013 | -8663 | -7708 |
| 10/15/2013 | -10814 | -2151 |
| 10/22/2013 | -5364 | 5450 |
Australian Dollar:
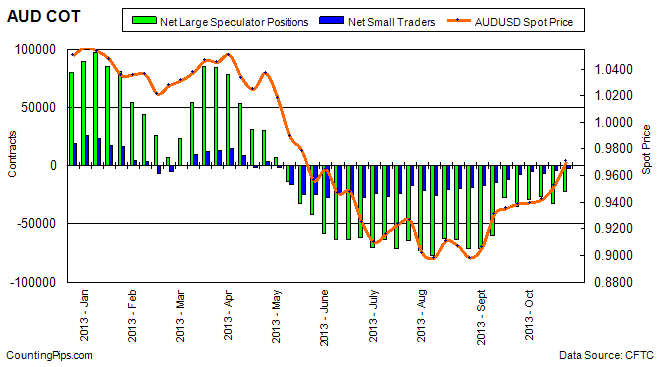
Last Six Weeks of Large Trader Positions: AUD
| Date | Lg Trader Net | Weekly Change |
| 09/17/2013 | -27360 | 32672 |
| 09/24/2013 | -34819 | -7459 |
| 10/01/2013 | -28804 | 6015 |
| 10/08/2013 | -26404 | 2400 |
| 10/15/2013 | -32237 | -5833 |
| 10/22/2013 | -22111 | 10126 |
New Zealand Dollar:
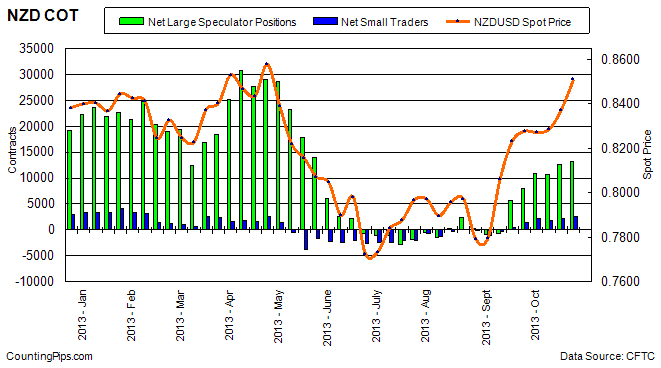
Last Six Weeks of Large Trader Positions: NZD
| Date | Lg Trader Net | Weekly Change |
| 09/17/2013 | 5657 | 6258 |
| 09/24/2013 | 8055 | 2398 |
| 10/01/2013 | 10891 | 2836 |
| 10/08/2013 | 10766 | -125 |
| 10/15/2013 | 12668 | 1902 |
| 10/22/2013 | 13114 | 446 |
Mexican Peso:
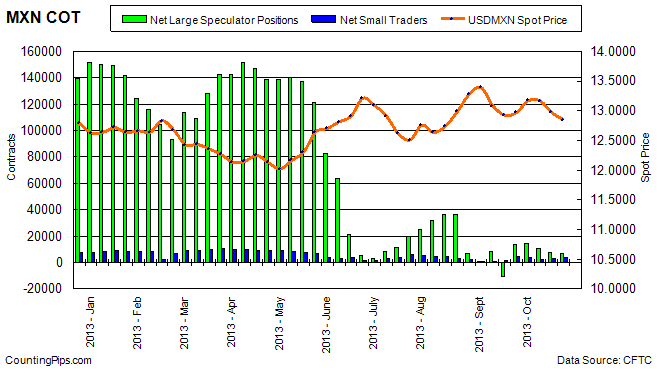
Last Six Weeks of Large Trader Positions: MXN
| Date | Lg Trader Net | Weekly Change |
| 09/17/2013 | -10201 | -18480 |
| 09/24/2013 | 14023 | 24224 |
| 10/01/2013 | 14601 | 578 |
| 10/08/2013 | 10933 | -3668 |
| 10/15/2013 | 7761 | -3172 |
| 10/22/2013 | 7214 | -547 |
*COT Report: The weekly commitment of traders report summarizes the total trader positions for open contracts in the futures trading markets. The CFTC categorizes trader positions according to commercial hedgers (traders who use futures contracts for hedging as part of the business), non-commercials (large traders who speculate to realize trading profits) and nonreportable traders (usually small traders/speculators).
The Commitment of Traders report is published every Friday by the Commodity Futures Trading Commission (CFTC) and shows futures positions data that was reported as of the previous Tuesday (3 days behind).
Each currency contract is a quote for that currency directly against the U.S. dollar, a net short amount of contracts means that more speculators are betting that currency to fall against the dollar and a net long position expect that currency to rise versus the dollar.
(The graphs overlay the forex spot closing price of each Tuesday when COT trader positions are reported for each corresponding spot currency pair.)
See more information and explanation on the weekly COT report from the CFTC website.
Article by CountingPips.com
Copyright © 2013 CountingPips - All Rights Reserved Disclaimer: The above is a matter of opinion provided for general information purposes only and is not intended as investment advice. Information and analysis above are derived from sources and utilising methods believed to be reliable, but we cannot accept responsibility for any losses you may incur as a result of this analysis. Individuals should consult with their personal financial advisors.
© 2005-2022 http://www.MarketOracle.co.uk - The Market Oracle is a FREE Daily Financial Markets Analysis & Forecasting online publication.


