


Stock Market Important Top Within Next Two Weeks
Stock-Markets / Stock Markets 2013 Oct 28, 2013 - 05:36 PM GMTBy: Andre_Gratian

 Current Position of the Market
SPX: Very Long-term trend - The very-long-term cycles are in their down phases, and if they make their lows when expected (after this bull market is over), there will be another steep decline into late 2014. However, the severe correction of 2007-2009 may have curtailed the full downward pressure potential of the 40-yr and 120-yr cycles.
Intermediate trend - SPX is back in a short-term uptrend but within days of a top.
Analysis of the short-term trend is done on a daily basis with the help of hourly charts. It is an important adjunct to the analysis of daily and weekly charts which discusses the course of longer market trends.
IMPORTANT TOP ABOUT TWO WEEKS AWAY!
Market Overview
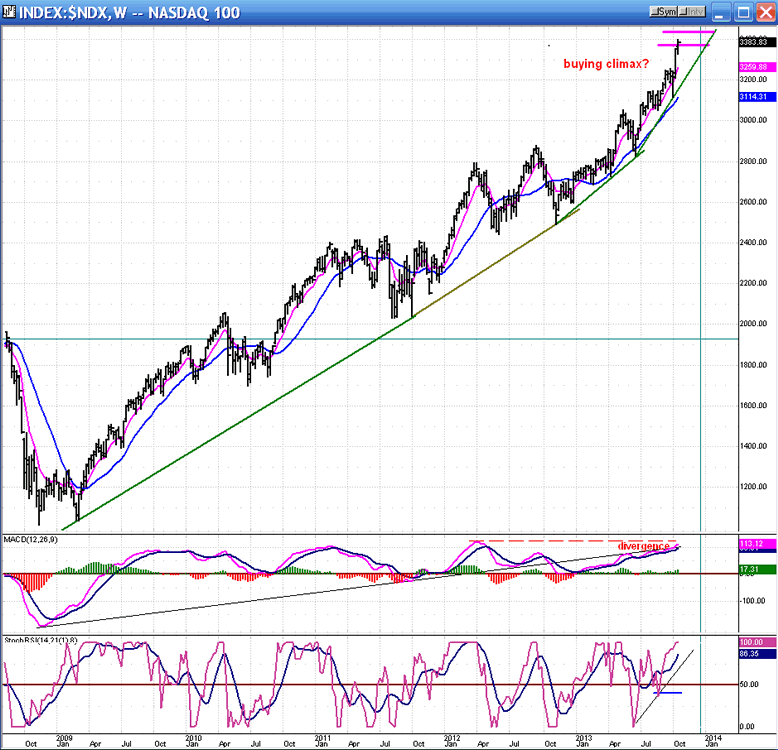
The indices are in the final stages of a move which started at SPX 1046. Will this be the final top of the bull market? Or will there be one more short-term correction followed by the final run-up to the top of the long-term uptrend which started in March 2009? It all depends on how one reads the current structure and entirely depends on what the market decides to do! ![]()
In any case, a short-term top is due in a matter of days. This is evidenced by the structure which shows that we probably started the 5th wave of the move from 1646 (although it could still be part of wave 4) and by the projection for this move which is now just a few points higher. This is also supported by the condition of the daily and hourly oscillators which are displaying topping patterns and negative divergence.
From a timing standpoint, the short-term top could coincide with the FOMC statement which is next Wednesday. But the fact is that the current short-term uptrend from 1646 has exceeded the high of the previous one by a sizable margin and thereby nullified the formation of an ending diagonal triangle, shifting the odds of having to endure one more correction before the final high is made. This is Tony Caldaro's analysis of the current EW structure and, since he has correctly analyzed the market since its 2009 low, I would not want to bet against him.
Chart Analysis
I don't think that I can improve on the manner in which I depicted the market's position last week. So I will simply update the same charts, starting with the Weekly NDX.
Last week saw a new high which slightly surpassed my first projection. The weekly bar exceeded it, but not by much, showing that the projected level may be attracting some sellers. But to be on the safe side, and especially if there is a short-term correction followed by a final surge, I believe that on the next move NDX can reach the new target of 3435 before peaking -- as determined by a Fibonacci projection. That would put QQQ around 84.00/84.50, which is its P&F projection.
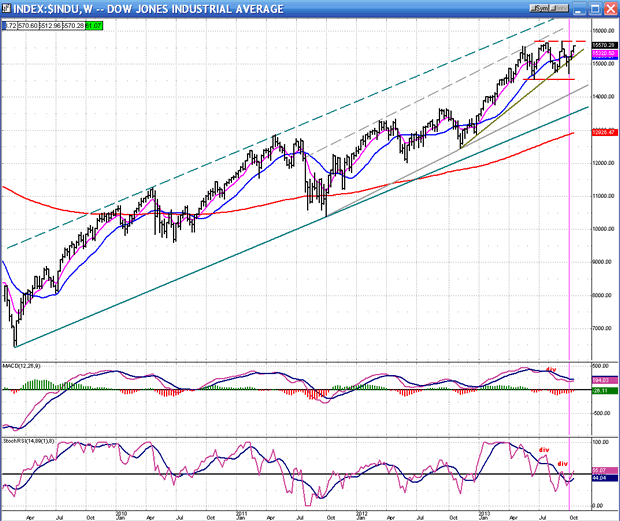
Last week, the DJIA made some progress, but not enough to reach a new high and stopping short of it by 140 points.
The Weekly Dow Industrials has a chart which is more interesting in that it is diverging from the NDX by such a wide margin. To begin with, the entire bull market phase confined its two early uptrends to the top of that major (green) channel. After a significant correction into October 2012, it started another intermediate (grey) channel which refused to go all the way to the top of the primary channel. This deceleration process started in May of this year, which was also the last time that DJIA touched the top of that secondary channel. For the past five months it could only trade in a broad lateral range while the other indices were making new highs. The loss of momentum is best seen in the two oscillators which were in a steady decline during this same time period.
The question of whether or not the DOW will make a new high will be important to the Dow Theorists. The DOW transportation index has surged to a new high in the past 3 weeks, and if the DOW itself makes a new high, they will argue that we are still in a bull market - and they will be right, technically! But that will not prevent the market from having a severe correction reminiscent of 2008. If Tony Caldaro is correct in his EW labeling, the top being formed (Primary III) will correspond to the top made in 2000 which brought about a decline lasting three years and 785 DOW points.
Because of the current cyclical configuration, this bear market should be much shorter, only lasting about a year, but it could be nearly as violent. A quick estimate gives us a potential decline of about 600 points on the SPX (to be refined later). So, you will have to decide for yourself if this qualifies as a bear market. Whether it does or not, I don't think you will want to stay long, even if you are a "long-term" investor.
The SPX hourly chart (below) is where the warnings that we are coming into a short-term top are very clear: most likely in the next few days.
First of all, I have labeled the structure as a five-wave pattern with the fifth wave currently under way (unless it turns out to be still part of wave 4). All the waves fit within a steep channel which, when broken, could signal the beginning of the correction.
Another sign that the decline has started will be when the blue 21-hr MA is penetrated decisively. It has done a remarkable job of containing waves 2 and 4, keeping them in shallow corrections. A more reliable sign will be when the 50-hr MA (light blue) has been breached.
Now let's look at the oscillators. In spite of the relatively shallow uptrend of wave 5, the SRSI is already overbought and in its terminal stages. As for the price of the MACD and the A/D index, they are flat-lining and showing severe divergence. Considering that the projection for this move is just a few points away, it looks as if we could be there in time for the Fed meeting on Wednesday.
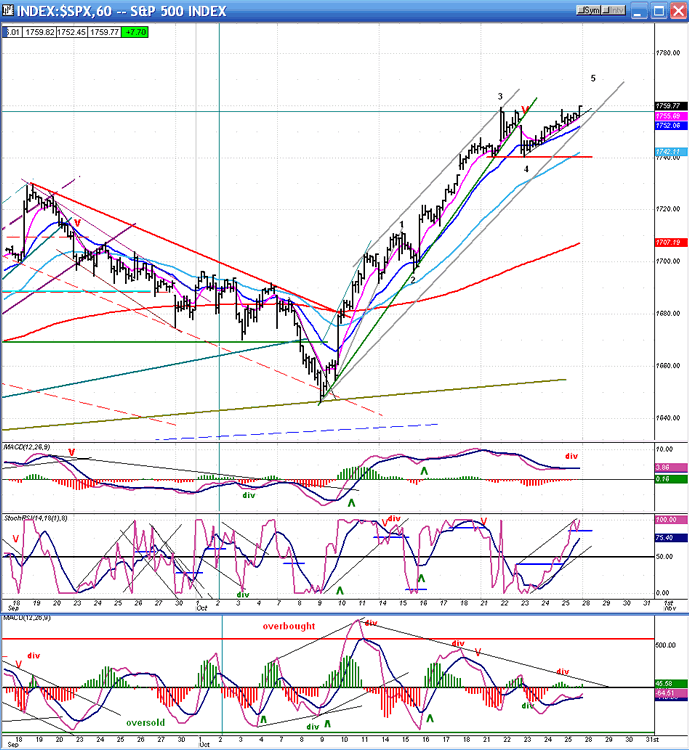
If we are to have a final correction followed by a final wave up, it may occur quickly if the cycles have anything to do with the final formation.
The three charts shown above are courtesy of QCharts
Cycles
An important cycle high is due in early to mid-November. Will that give the market enough time for a correction followed by the final surge?
I will leave the next sentence as it was written last week: "We also should start to look for solid evidence that the longer-term cycles are taking charge of the trend. Is the DOW the first to succumb to these longer-term pressures?"
Breadth
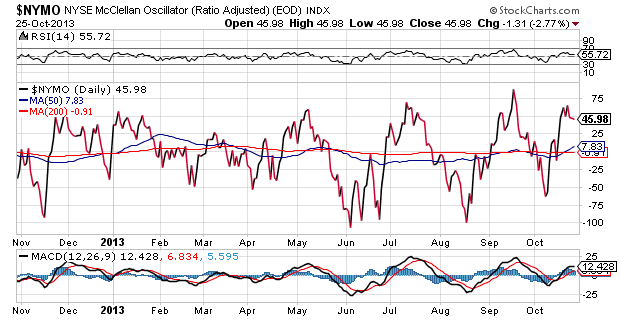
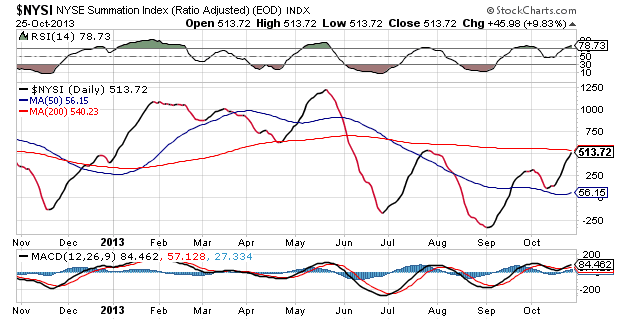
The McClellan Oscillator and Summation Index appear below (courtesy of StockCharts.com).
The McClellan Oscillator has hardly moved in the past week, looking very similar to my own daily A/D oscillator. Whether it makes a new high or not in the next few days is immaterial since its fate is already pretty much determined by the lack of strength in the hourly index.
Because NYMO remained positive, NYSI has continued to advance. But it's hardly a show of strength, and we'll have to see how the next market correction affects it.
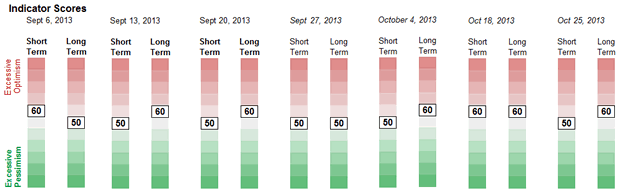
Sentiment Indicators
The SentimenTrader (courtesy of same) long-term indicator score remains at 60 for the third consecutive week. I would prefer to see it at 70 as a clearer indication of a market top.
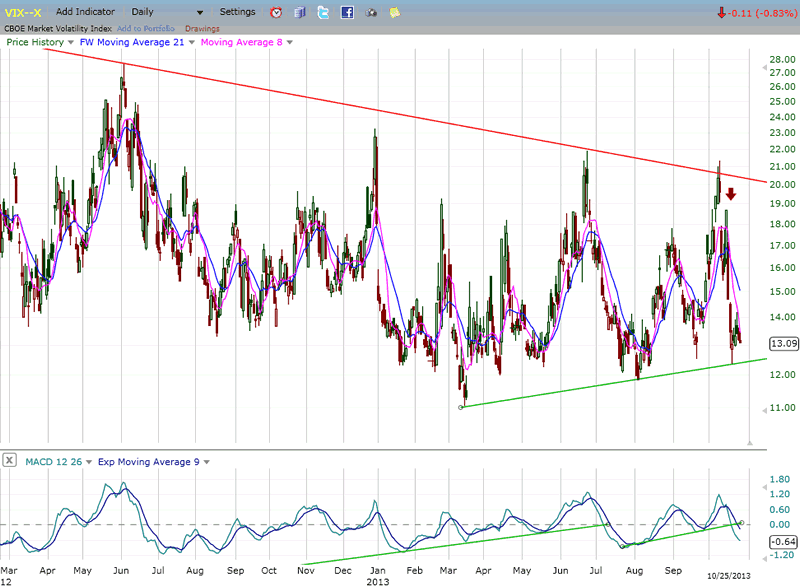
VIX
VIX has returned to its base line and seems to be holding on to its positive divergence, but there has been very little volatility at the low and this has created only a minor base formation on the P&F chart. We'll have to see if this turns out to be a problem in determining the market top and the range of the next move in VIX.
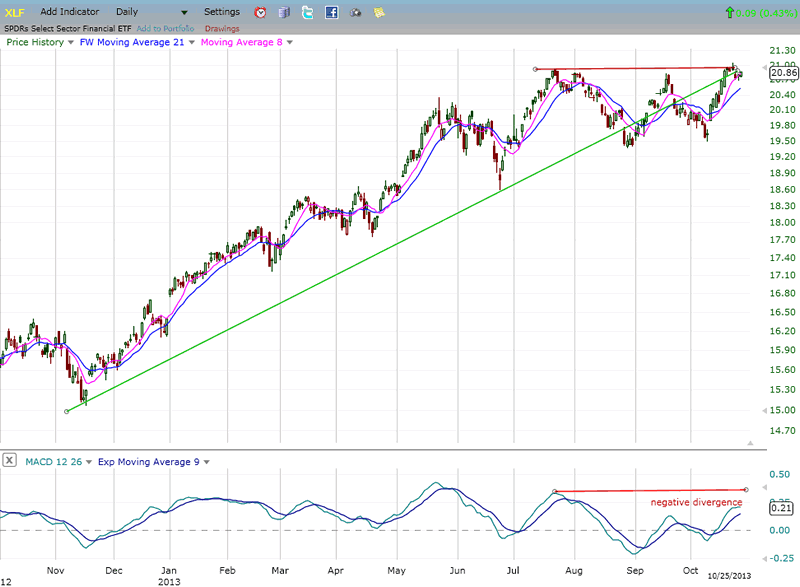
XLF (Financial Index)
XLF is behaving the way it should at a market top by losing strength relative to the SPX. That contrast just needs to become a little more pronounced in the days ahead.
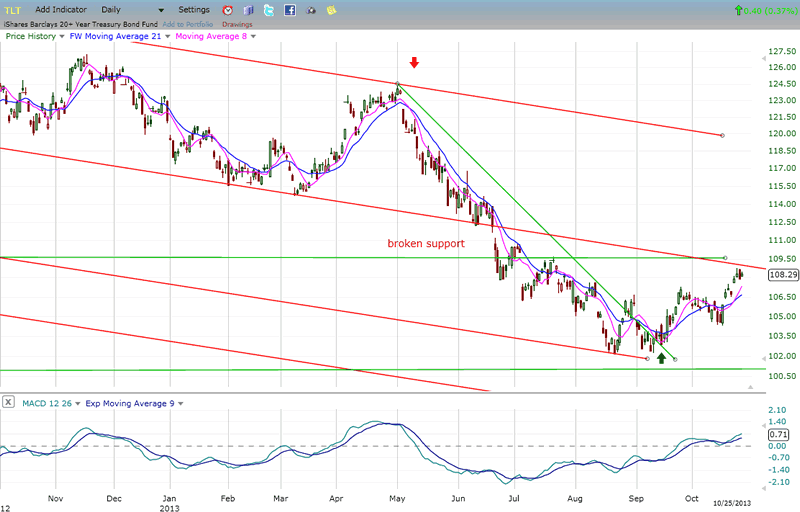
BONDS
TLT has continued to bounce from its previous low. It has almost reached the broken support level which should provide resistance to the uptrend. In addition, it is approaching the mid-range of the channel which delineates its long-term downtrend. This combination could stop its advance, and it is reinforced by the small base which only carries a low P&F count. That could shortly turn TLT back down. Let's give it a week or two to determine what it wants to do.
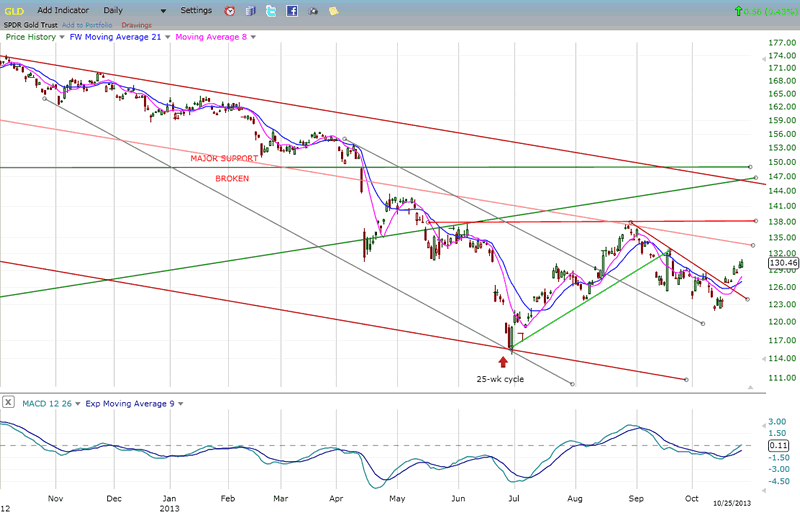
GLD (ETF for gold)
As mentioned last week, GLD is looking a little more bullish short-term, but since this move is part of an upward correction in a long-term downtrend, it should be limited in price and scope. After it has concluded in the next couple of weeks, the index will be susceptible to continue its downward trek, perhaps to the 110 level which has been mentioned several time as a likely objective.
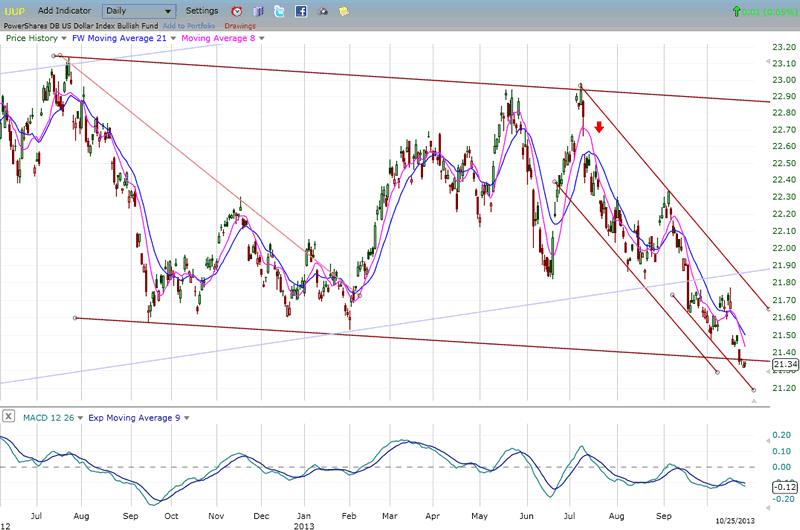
UUP(dollar ETF)
UUP looks as it may be coming to the end of its downward journey. It has reached the low of its large corrective channel and is staying away from the bottom line of the shorter, steeper channel. Also, faint signs of deceleration and positive divergence are beginning to show in the MACD. This should become more evident in the price chart over the next couple of weeks.
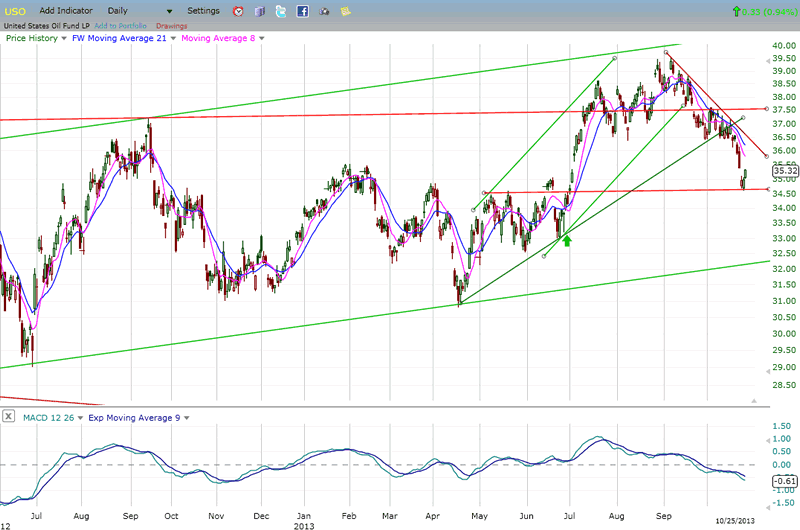
USO (United States Oil Fund)
Last week, USO broke its uptrend line and quickly plunged to the support level provided by the top of a previous congestion pattern. Whether it rebounds immediately or spends some time making a base, it does not look ready to start a significant recovery. This short-term downtrend was predictable after USO struggled to reach the top of its shallow bullish channel. Its next challenge will be to remain above the current support level and to refrain from dropping all the way down to the bottom of that channel.
Summary
That we are coming to a significant top, is clear. What is murky is whether this top is formed over the next 2 or 3 days, or over the next couple of weeks. The latter seems more probable.
FREE TRIAL SUBSCRIPTON
If precision in market timing for all time framesis something that you find important, you should
Consider taking a trial subscription to my service. It is free, and you will have four weeks to evaluate its worth. It embodies many years of research with the eventual goal of understanding as perfectly as possible how the market functions. I believe that I have achieved this goal.
For a FREE 4-week trial, Send an email to: ajg@cybertrails.com
For further subscription options, payment plans, and for important general information, I encourage
you to visit my website at www.marketurningpoints.com. It contains summaries of my background, my
investment and trading strategies, and my unique method of intra-day communication with
subscribers. I have also started an archive of former newsletters so that you can not only evaluate past performance, but also be aware of the increasing accuracy of forecasts.
Disclaimer - The above comments about the financial markets are based purely on what I consider to be sound technical analysis principles uncompromised by fundamental considerations. They represent my own opinion and are not meant to be construed as trading or investment advice, but are offered as an analytical point of view which might be of interest to those who follow stock market cycles and technical analysis.
Andre Gratian Archive |
© 2005-2022 http://www.MarketOracle.co.uk - The Market Oracle is a FREE Daily Financial Markets Analysis & Forecasting online publication.