


Agricultural Commodities - Grow It, And They Will Eat It
Commodities / Agricultural Commodities Oct 28, 2013 - 12:42 PM GMTBy: Ned_W_Schmidt

 "Build it, and they will come" has been the motivation for many dreams. Baseball fields, restaurants, and other follies have sprouted from belief in this concept. Much of the real estate industry of times now past lived by this philosophy. That worked until they did not come, and then the bankers came for the remains.
In Agri-Food we have a similar motto: Grow it, and they will east it. We worry little about relying on such a belief, for people eating is, unlike baseball, not optional. That the world will eat it if it is grown can be observed in the following chart.
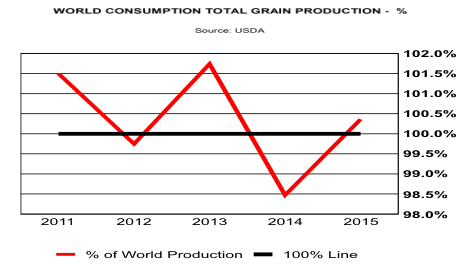
Note on chart: USDA works in crop years, not calendar years. At present we are in crop year 2014. That year runs from September 2013 through the end of August 2014. The current Northern Hemisphere harvest in process, which includes that now concluding in the U.S., is part of the data point for 2014 in the graph.
Plotted in the chart is percentage of the world's total grain production that is consumed. That ratio is expressed as a percentage, and uses the right vertical axis. A solid black line highlights the 100% level which means that all of the world's grain production is being consumed.
In the first three years plotted in the graph the world's consumption of total grains produced averaged more than 100%. Essentially, over that period the world consumed all the grains produced plus some of that which had been stored from previous years. The value for 2013, the highest in the chart, is due in part to the drought which dramatically reduced U.S. grain production in the Fall of 2012.
Low value for 2014 is due to the strong recovery in Northern Hemisphere production, particularly in the U.S. The harvest, now moving toward completion in North America, is to be one of the best experienced. As a consequence of that bountiful harvest, the percentage of it that will be consumed this year will decline. However, we must recognize that this harvest has not been a "normal" one. It is better than normal. Weather conditions have been, on average, better than good.
We should not expect a repeat of this year's excellent Northern Hemisphere harvest. Due to abnormally low corn prices, for example, U.S. farmers will plant less acres in corn in the Spring of 2014. One forecaster is predicting that U.S. corn acreage will drop by more than 5 million acres. Betting that the weather will not have any unpleasant bumps is not wise. All of this means that in crop year 2015 the world will again eat more grain than it produces. As we said in the beginning, "If we grow it, they will eat it". Along with that situation comes higher Agri-Food prices. In short, today's Agri-Food prices are as good as they will be.
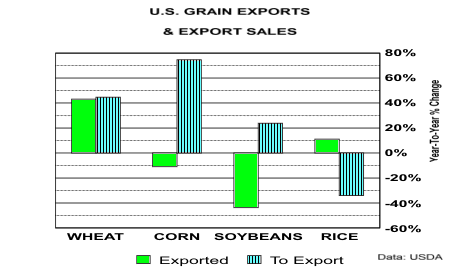
Above chart shows that indeed they are coming to get the Agri-Grains. Plotted in that chart is the year-to-year percentage change in export orders, blue striped bars, and export sales, green bars. Export sales that have been made but not yet fulfilled are labeled "To Export". For example, when compared to last year, unfilled wheat export orders have increased by more than40%, corn sales are 70% higher, and soybeans up by more than 20%. Volumes exported of corn and soybeans are down because the harvest is still in process and those grains are just now flowing into export pipeline.
U.S. grains, like those in the Ukraine, Russia, Argentina, and Brazil, to be exported move to ports to be shipped to China, Egypt, and other importing nations. After those ships unload their cargo, a return trip is made carrying the reward for this whole process, money. Agri-Food industry is the business of swapping Agri-Foods for money. In 2014 and the years to follow a lot of money is going to be swapped for Agri-Foods of all kinds, from palm oil to corn to pork. Is your portfolio ready for an unfair share of that Agri-Money?
By Ned W Schmidt CFA, CEBS
AGRI-FOOD THOUGHTS is from Ned W. Schmidt,CFA,CEBS, publisher of The Agri-Food Value View, a monthly exploration of the Agri-Food grand cycle being created by China, India, and Eco-energy. To contract Ned or to learn more, use this link: www.agrifoodvalueview.com.
Copyright © 2013 Ned W. Schmidt - All Rights Reserved
Ned W Schmidt Archive |
© 2005-2022 http://www.MarketOracle.co.uk - The Market Oracle is a FREE Daily Financial Markets Analysis & Forecasting online publication.