Friday’s Fantastic Stock Market Finish
Stock-Markets / Stock Markets 2013 Oct 25, 2013 - 04:28 PM GMTBy: PhilStockWorld
 1,752. You can't argue with that.
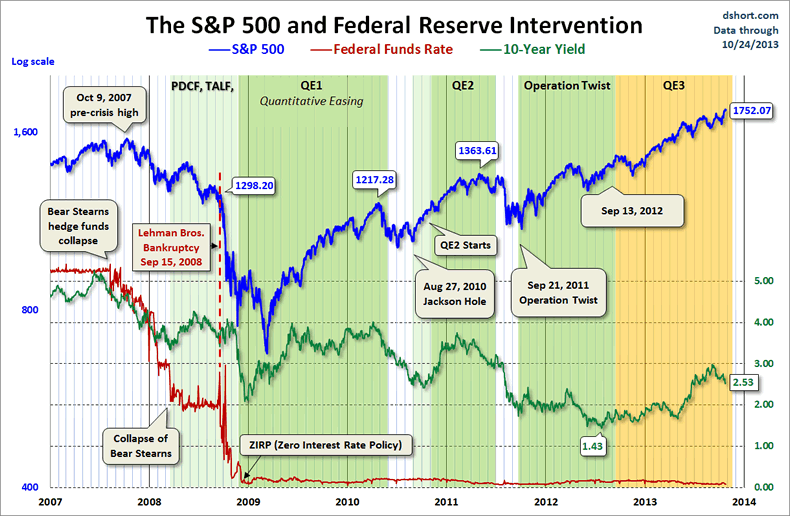
We're just a bit off Tuesday's spike high of 1,759 and we closed that day at 1,754 – up 1,088 points (163%) from our March, 2009 low of 666 (the mark of the Dimon!). As you can see from Doug Short's chart, we've had 4 rounds of QE to get us this far and that was after a couple of bailouts but that's all water (or money) under the bridge and here we are…

We've been plowing higher this week, despite a lot of poor earnings reports, in anticipation of next week's Fed meeting and the anticipaiton of not only extending QE "Forever" for a little longer but now talk is going on of INCREASING it, because our economy is weaker than the Fed thought (as evidenced by many disappointing earnins report and lackluster job creation). While these are possibly good reason for more QE – are they good reasons for record market highs?
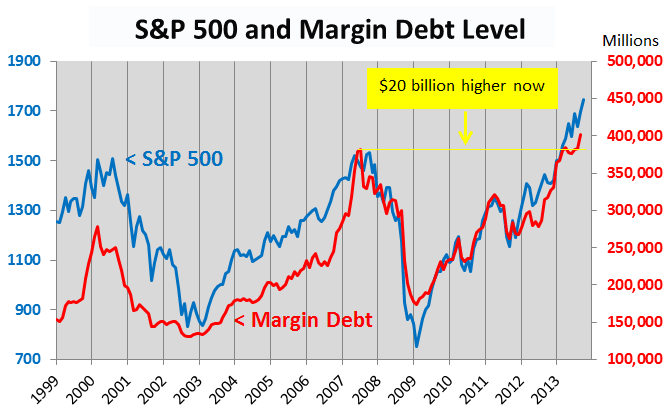
Apparently both traders and Banksters think it is as we now have $20Bn more margin debt than we had when we made that horrific mistake of having way too much margin debt in 2007. Remember how we were "shocked" that the Global economy wasn't as good as we thought and that China was weak and Europe had problems and the market dropped 60% in 2008? Yeah, good times…

No wonder, just 5 years later, everyone is so anxious to do it again! This time IS different because last time we didn't have the Fed pumping $85Bn a month into the system along with the BOJ's $75Bn and the PBOC's $30Bn and whatever that thing Europe is doing is. In 2008 Bush handed out $160Bn as a one-time stimulus but we blew all that money on $140/barrel oil and $5 gasoline – good times…
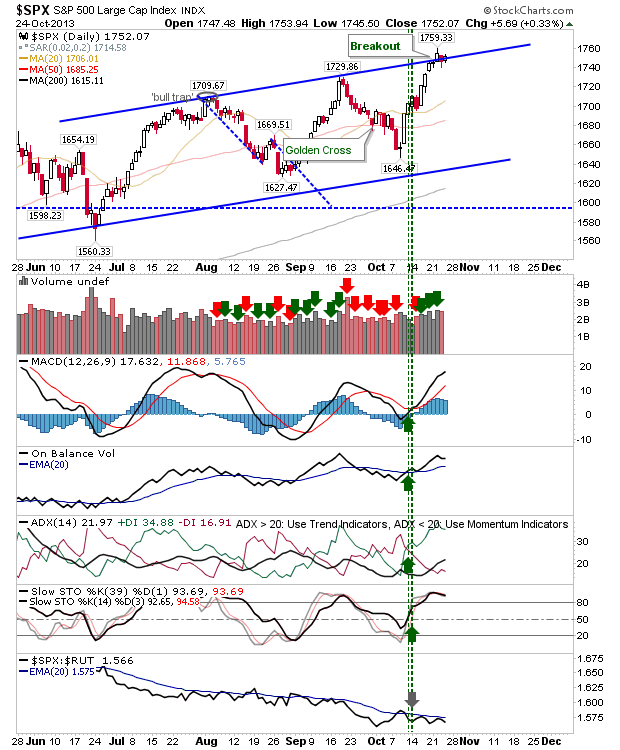
Declan has a chart for us of the S&P that shows the channel we're in and why we chose this spot to short. We may break back down here and have a fun ride to 1,650 (down 5.7%) or we may break out. If we do break over 1,760 – we'll be very happy to go bullish. We have our "5 More Trade Ideas that Make 500% in an Up Market" from early Sept, when we were on the low side of the channel.

Just like we make bullish trades when we're low in the channel, we like to make some bearish ones when we're high in the channel. This is what they call buying low and selling high, which people think is impossible to get right but here's a very clearly defined 5-month channel that shows those people are wrong – it just takes the PATIENCE to allow the channels to form and then the CONVICTION to make the right trades at the right time.
We began a new Long Put List for the first time since last year as we think there's a good chance of a 5% correction here and the possibility of a major pullback if the Fed grinches Christmas. The same amount of QE won't do it – that's why we have this channel in the first place and these earnins reports certainly aren't going to save us either.
We'll be adding a few new trade ideas to the Long Put List this morning, probably AMZN (sellng into their silly spike to $360, ZNGA ($4), SPY ($175) and QQQ ($83). Of course we'll use options for leverage, like the SPY Jan $168 puts for $2. It's not that we expect or need SPY to drop 4.5% to $168, the Delta on the puts is .28 so we make .28 for each $1 (10 S&P points) SPY does fall so our option contract gains 14% for each 0.5% the S&P falls (28:1) – that's how you hedge!

We have an easy stop out at $176+ and that will cost us 14% of the position but let's say we have $100,000 invested bullishly that more or less moves down with the S&P so we expect to lose $5,000 on a 5% drop in the index. Well, all we have to do to cover that is figure out what we want to cover it with and lets say we buy 10 contracts for $2,000 (2% of our portfolio).
Then, if the S&P drops 5%, to 1,662, SPY will drop to $166 and that's $9 x our delta of .28 = $2.52 for a 125% gain and we'd get back $4,520, making up a great deal of our long losses. $2,000 is the cost of our insurance (2% of our longs) and, if we're locking in gains we've already made – then we can certainly afford the insurance (and that's even assuming we don't stop out of the hedge with our 14% loss, like we're supposed to). That's the essence of hedging!
If the market does break higher, we will wave goodby to our channel conviction and try to find some companies that aren't too overbough yet. That may prove a little tricky, but we'lll cross that bridge (over 160% gain from March, 2009) when we come to it.
Have a nice weekend,
- Phil
Philip R. Davis is a founder of Phil's Stock World (www.philstockworld.com), a stock and options trading site that teaches the art of options trading to newcomers and devises advanced strategies for expert traders. Mr. Davis is a serial entrepreneur, having founded software company Accu-Title, a real estate title insurance software solution, and is also the President of the Delphi Consulting Corp., an M&A consulting firm that helps large and small companies obtain funding and close deals. He was also the founder of Accu-Search, a property data corporation that was sold to DataTrace in 2004 and Personality Plus, a precursor to eHarmony.com. Phil was a former editor of a UMass/Amherst humor magazine and it shows in his writing -- which is filled with colorful commentary along with very specific ideas on stock option purchases (Phil rarely holds actual stocks). Visit: Phil's Stock World (www.philstockworld.com)
© 2013 Copyright PhilStockWorld - All Rights Reserved Disclaimer: The above is a matter of opinion provided for general information purposes only and is not intended as investment advice. Information and analysis above are derived from sources and utilising methods believed to be reliable, but we cannot accept responsibility for any losses you may incur as a result of this analysis. Individuals should consult with their personal financial advisors.
PhilStockWorld Archive |
© 2005-2022 http://www.MarketOracle.co.uk - The Market Oracle is a FREE Daily Financial Markets Analysis & Forecasting online publication.


