Why The Fed Will Fail and The Cycles Prevail
Stock-Markets / Financial Markets 2013 Oct 20, 2013 - 03:15 PM GMTBy: Clif_Droke
 Despite its intent to boost asset prices and restore the economy, the Federal Reserve has run into a major obstacle in achieving that goal. This obstacle is serving as a reminder that ultimately the long-term natural cycles of inflation and deflation govern the market and that intervention will usually fail.
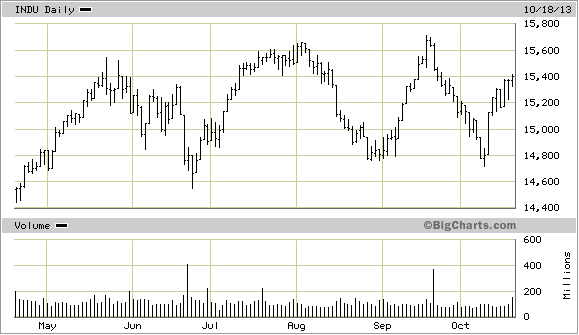
That major factor that is engineering the Fed s eventual defeat is the 10-year Treasury Yield Index (TNX). The rally in Treasury yields from May through September took a lot of steam out of the financial market. The industrial stocks were heavily affected by rising rates as can be seen by the volatile performance of the Dow Jones Industrial Average (below). The reason is that the industrial sector is much more sensitive to changes in interest rates than the tech sector.

The reason why rising interest rates are a potentially serious problem for the economy - as well as a stumbling block for stocks - is explained by Chirantan Basu of Zacks: "Rising yields lead to higher mortgage interest rates.... Higher mortgage interest rates mean higher monthly mortgage payments, which slows down the real estate market as home buyers put off buying new homes or upgrading to larger homes. This drop in demand could depress home resale values, which leads to a drop in household net worth. People feel poorer and less optimistic about the economy, which usually means they spend less on non-essential items."
Some economists are trying to underplay the effects of rising Treasury by claiming higher yields reflect a stronger economy. While this may true in normal cases, the present case isn t one of them. Treasury yields started rising soon after the Fed telegraphed its intention to begin tapering QE. Since household borrowing for consumption is the lifeblood of developed economies like the U.S., higher rates are a major point of concern and can t be underestimated. Rising yields are also the point where the bond market starts to influence and limit U.S. central bank balance sheet expansion due to the increased cost of debt.
Another point worth discussing is that while rising yields may have reflected an improving economy in the "old days" before widespread globalization, the relationship between yields and economic performance is much more complex today. Alen Mattich, writing in The Wall Street Journal, observed that rising Treasury bond yields increase yields across other sovereign debt markets, thereby tying the hands of central bankers. He points out that Bank of England Governor Mark Carney recently made clear that rising U.S. yields were an unwelcome complication for the U.K. economy.
"Unfortunately," writes Mattich, "other central bankers will find it hard to battle against U.S. headwinds, if only because by trying to keep downward pressure on domestic interest rates, they also run the risk of triggering a currency crisis."
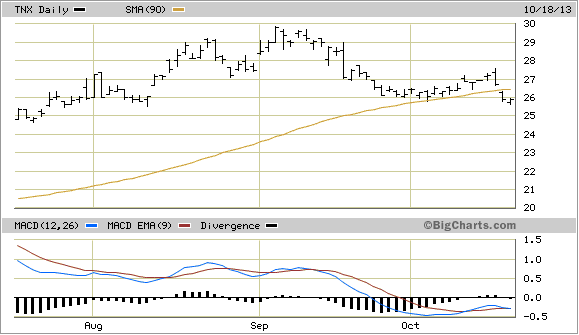
In recent weeks I ve mentioned the importance of the 90-day moving average with regard to the Treasury Yield Index. In recent months pullbacks in TNX always found support somewhere above the 90-day MA, including most recently in early October. On Oct. 17, however, TNX broke decisively under the 90-day MA as you can see here. This indicates that the Treasury yield has lost much of its former upside momentum and is now weaker than it was this summer. This in turn should take some of the pressure off equities and make it easier for stocks to rally in the near term.

My best "guesstimate" in terms of potential downside for TNX is that the index should decline no further than approximately the 25.00 level as shown in the above chart. I m guessing we ll start to see support becoming established for TNX in the next few weeks yields grind out a lateral trading range. In other words, despite the recent weakness we may not have seen the end of "high" yields.
Another factor working against the Fed s attempt at creating asset price inflation is the proverbial cockroach in the casserole, namely the anticipated end to QE3. For months investors have nervously awaited the Fed s official announcement as to when quantitative easing will finally be "tapered." The Fed has been sly with its handling of this issue, first getting investors used to the idea of the coming end of QE, then surprising everyone by announcing its continuation. This tactic can be interpreted as a form of financial market engineering in itself, although that s beyond the scope of this commentary.
Even if QE continues into 2014, consumers, mortgage holders and businesses will continue to act as if the end is imminent. As Ramesh Ponnuru has pointed out, "When the Fed creates an impression about future spending levels, it affects the spending that people undertake today in anticipation of that future. So when the Fed suggests that it will pursue a tighter money policy in the future, it is effectively tightening money in the present."
The point is that the gorilla is out of the cage and investors know that QE s days are numbered. This will affect the various financial markets differently. Gold investors fear that diminished QE will hurt the price of gold, but if it happens in 2014 it will allow the 120-year cycle to bottom with greater emphasis, which could force a return to the safe havens. After 2014 a new long-term cycle of inflation will commence, which will definitely benefit the yellow metal.
Stock Market Cycles
Take a journey with me as we uncover the yearly Kress cycles - the keys to unlocking long-term stock price movement and economic performance. The book The Stock Market Cycles covers each one of the yearly cycles in the Kress Cycle series, starting with the 2-year cycle and ending with the 120-year Grand Super Cycle.
The book also covers the K Wave and the effects of long-term inflation/deflation that these cycles exert over stock prices and the economy. Each chapter contains illustrations that show exactly how the yearly cycles influenced stock market performance and explains where the peaks and troughs of each cycle are located and how the cycles can predict future market and economic performance. Also described in this original book is how the Kress Cycles influence popular culture and political trends, as well as why wars are started and when they can be expected based on the Kress Cycle time line.
Order today and receive an autographed copy along with a copy of the booklet, "The Best Long-Term Moving Averages." Your order also includes a FREE 1-month trial subscription to the Momentum Strategies Report newsletter: http://clifdroke.com/books/Stock_Market.html
By Clif Droke
www.clifdroke.com
Clif Droke is the editor of the daily Gold & Silver Stock Report. Published daily since 2002, the report provides forecasts and analysis of the leading gold, silver, uranium and energy stocks from a short-term technical standpoint. He is also the author of numerous books, including 'How to Read Chart Patterns for Greater Profits.' For more information visit www.clifdroke.com
Clif Droke Archive |
© 2005-2022 http://www.MarketOracle.co.uk - The Market Oracle is a FREE Daily Financial Markets Analysis & Forecasting online publication.


