


Options Market Forecasting Future Stock Market Price Action Direction
Stock-Markets / Options & Warrants Oct 10, 2013 - 10:54 AM GMTBy: J_W_Jones

 By now the major media outlets have made sure to inform the public that the U.S. government is shut down, or partially shut down depending on your political perspective. Most financial pundits are looking to the recent past for clues about what to expect in the future.
While the situation appears to be similar to what we witnessed in 2011 with the debt ceiling debacle, the outcomes may be significantly different. I am a contrarian trader by nature, and as such I am constantly expecting for markets to react in the opposite way from what the majority of investors expect.
A significant number of financial pundits and writers all have a similar perspective about what is likely to occur. It seems most of the financial punditry believe that until there is a resolution in the ongoing government debacle, market participants should expect volatility to persist. Some of the talking heads are even calling for a sharp selloff if no decision on the debt ceiling is made by early next week.
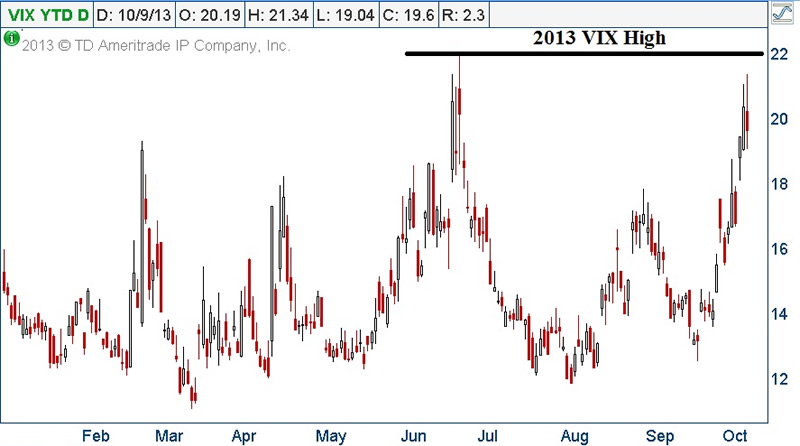
The debt ceiling decision needs to be made by midnight on October 17th otherwise the first ever default on U.S. government debt could occur. Thus far, the volatility index (VIX) has moved higher as investors and money managers use the leverage in VIX options to hedge their long exposure.
As can be seen below, we are seeing the VIX trade at the second highest levels so far in 2013.
The volatility index (VIX) is clearly sending a warning signal about risk in the S&P 500 Index based on price action. However, that warning signal relies on current uncertainty in the marketplace. Most sell side analysts and economists believe that once a deal is done, risk assets will rally. What happens if they are wrong?
Trying to play a fool’s game by calling future price action correctly without supporting facts in hopes of being right is not honest analysis or commentary. Instead, why wouldn’t investors put the situation in context using information available from calculations derived from option chains? I want to be clear in saying I have no earthly idea what is going to happen once a deal is reached or when said deal will be reached. I have no idea!
Readers should be completely leery of anyone trying to tell you what is going to happen with supposed certainty. Whether they want to admit it or not, no one in the financial punditry knows for sure what is going to happen.
I believe that the options marketplace is much more competent about future price action than some financial pundit or sell side analyst that is trying to push their book of assets. As such, the S&P 500 Cash Index (SPX) option chain is shown below:
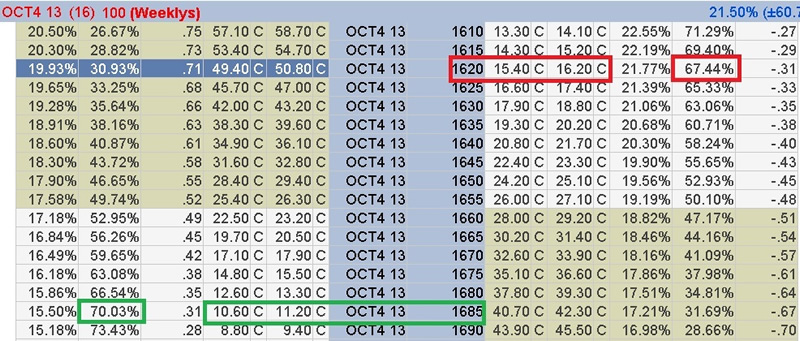
As can be seen above, the probability that the SPX 1,620 October 10/25 Put expires worthless is roughly 68%, or 1 standard deviation from Wednesday’s closing price. The probability of the SPX 1,685 October 10/25 Call expiring worthless is also roughly 68%, or 1 standard deviation to the upside from Wednesday’s closing price.
As of the closing bell on Wednesday, October 9th the SPX options chain is telling us that there is a 68% probability that price will stay between 1,620 and 1,685 by the close of business on Friday, October 25th.
Where the probability analysis gets interesting is when we look at a 2 standard deviation move which gives us a near 90% probability of being accurate with our expected price range. The 2 standard deviation move from the October 9th close on the put side is 1,525. The 2 standard deviation move from the October 9th closing bell on the call side is 1,720.
Thus, as of the closing bell on Wednesday, October 7th the SPX options chain is telling traders that there is a 90% probability that the S&P 500 Cash Index (SPX) will close on October 25th between 1,525 and 1,720.
This analysis gives us some expected price ranges for the S&P 500 in the near future. However, there is something I want to point out to readers about what the SPX option chain is telling careful observers. As of the close of business on October 9th, the S&P 500 Cash Index closed the day at 1,656. At this point we need to revisit the previous price ranges.
The one standard deviation (68%) price range is shown below:
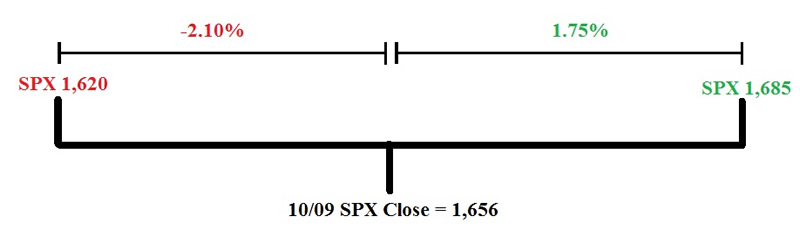
As can be seen, the 1 standard deviation price range is centered fairly well with the closing price on 10/09. However, it should be noted that the SPX options chain is implying slightly more risk to the downside. Consequently, something rather significant occurs when we look at the 2 standard deviation (90% probability) expected range for the SPX options chain.
The two standard deviation price range is shown below:
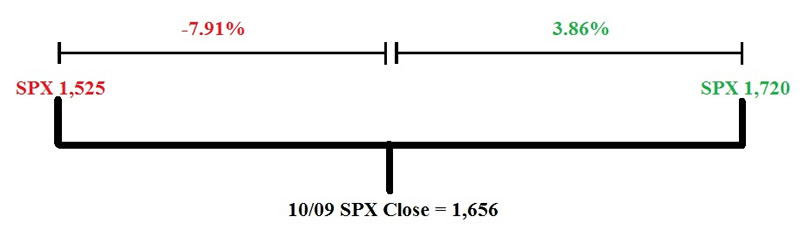
The upside expectation that has a 90% probability of being accurate implies a 3.86% increase potential by October 25th. However, the 90% probability of being accurate to the downside implies a -7.91% move. Clearly the option market is telling us that the marketplace believes there is much more possible risk to the downside.
The question I would pose to readers and financial pundits alike is the outcome no one is talking about. What is the least likely outcome for the markets to traverse? In my humble opinion, the least likely expectation would be that we get a resolution regarding the government shutdown and the debt ceiling. Then as expected risk assets rally sharply higher, only to reverse and selloff sharply a short time later.
That would be the least likely scenario that market participants would expect and a large downside move is being priced into the S&P 500 Index option chain. I want to reiterate that I have no idea what is going to happen, but what I do know is the S&P 500 Index options are telling us that it is possible for a large selloff to potentially occur.
The most important question of all is what source of information is more credible? Is information coming directly from the marketplace in an extremely liquid underlying asset like SPX options credible? Or is a financial pundit trying to push their book of assets or their firm’s book a more likely source of honest information? I will let readers decide.
If you are looking for a mathematical and statistical based approach to trading, OptionsTradingSignals.com may be a perfect fit to improve your option trading results. Give OptionsTradingSignals.com a try today!
J.W. Jones is an independent options trader using multiple forms of analysis to guide his option trading strategies. Jones has an extensive background in portfolio analysis and analytics as well as risk analysis. J.W. strives to reach traders that are missing opportunities trading options and commits to writing content which is not only educational, but entertaining as well. Regular readers will develop the knowledge and skills to trade options competently over time. Jones focuses on writing spreads in situations where risk is clearly defined and high potential returns can be realized.
This article is intended solely for information purposes. The opinions are those of the author only. Please conduct further research and consult your financial advisor before making any investment/trading decision. No responsibility can be accepted for losses that may result as a consequence of trading on the basis of this analysis.
© 2005-2022 http://www.MarketOracle.co.uk - The Market Oracle is a FREE Daily Financial Markets Analysis & Forecasting online publication.