October Stock Market Correction and the Secret Ruler of The Federal Reserve
Stock-Markets / Stock Markets 2013 Sep 30, 2013 - 07:28 AM GMTBy: Clif_Droke
 In recent commentaries we've looked at the possible scenario for an October stock market correction. This scenario is based on Kress cycle "echo" considerations as well as a number of technical and market psychology indicators which suggest a market top may be forming. A number of individual stocks are still bullish, but intermediate-term indicators suggest that distribution has been underway in various sectors and industry groups for some time. Accordingly, traders should remain wary of the possibility for an "October surprise."
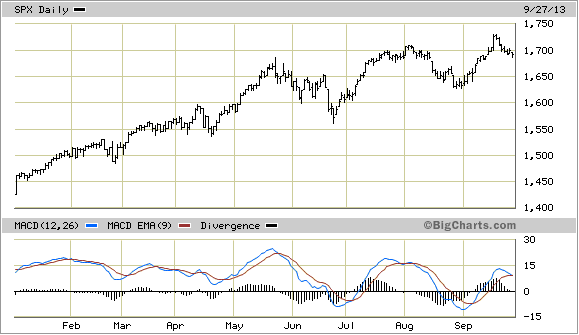
Another sign that the market may be undergoing distribution (i.e. internal selling) can be seen in our favorite index for measuring the broad market. A "3-point reversal" signal has shown up in the daily chart of the S&P 500 Index. This particular pattern occurs whenever the SPX makes three higher peaks in succession while the daily MACD indicator makes three lower peaks, thereby failing to confirm the new highs in the S&P.
The three higher highs in the SPX can be seen in the following graph. The first high was made in May near the 1,675 level; the second high was in early August at 1,709; the third and most recent peak was made on Sept. 18 at the 1,725 level. Note the divergent pattern in the MACD indicator during the May-September period. This pattern is redolent of internal weakness and could be masking a distribution campaign underway by "smart money" traders.

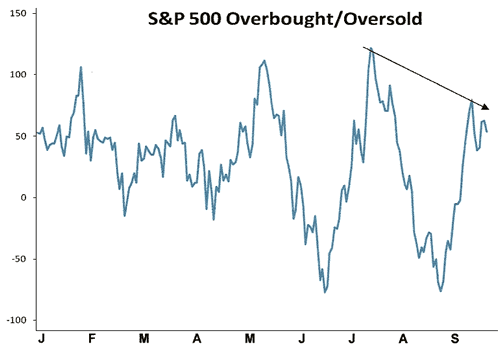
Another negative divergence signal can be seen in the 20-day price oscillator for the S&P. This indicator is an important measure of the market's short-term "overbought" or "oversold" status. It can also be used as a divergence indicator, however, and in this case the lower peak in the 20-day oscillator in September while the SPX made a higher high is a "heads up" that the market is somewhat vulnerable to selling pressure as we enter October. The indicator's signals aren't infallible, of course, but the number of negative divergences in several technical indicators is starting to look like a warning that the market could be in for another period of volatility in the near future.

The woes for many individual stocks began in August with the Fed's intimation that the central bank would start "tapering" its $85 billion/month asset purchase program in September. The warning turned out to be a "head fake" since the Fed kept the rate of purchases intact, but the cat was already out of the bag. As we talked about in a previous commentary, the Fed's threat to decrease the level of stimulus was tantamount to actually doing so. Investors reacted by selling bonds and interest rate-sensitive stocks and the mortgage market felt the sting. Tight money, in other words, became a reality as soon as certain Fed members started voicing their future intentions.
The question now becomes one of how much longer the Fed can keep the inevitable at bay. Sooner or later they'll be forced to scale back on bond buying and its hand will eventually be forced by the direction of short-term Treasury rates. A colleague recently shares an insight with me concerning the Fed Funds Rate (FFR) and 3-month Treasury rates that's worth repeating:
"I've been thinking lately that Fed policy is like the Wizard of Oz on the big screen. Many believe in it and perception has become reality to an extent. For one, the Fed Funds Rate is never raised in early stages of the bull is it? Hmm, so they wait till the bull is rolling over and/or rates are rising (like the 3-month rate which the FFR absolutely HAS to follow - think this through!). Then the Fed gets blamed for the downturn which raises the Fed's power in the minds of the people. That's mental conditioning if you ask me."

Indeed, the invisible ruler of the Federal Reserve is the market's future expectations of inflation. We saw this in 2004 when the 3-month Treasury yield began rising at the start of the year. Then Fed Chairman Greenspan was forced to follow suit a few months later by raising the Fed Funds Rate, a trend which continued for the next three years and which contributed to the credit crisis.
We're still likely a long way from when the 3-month Treasury yield begins rising enough to force the Fed to raise the FFR, but even so the consequences of an unsettled stock and bond market due to uncertainty over the Fed's next move will provide more than enough headaches for investors.
Gold
Gold ETF managers have apparently embraced the bull case for gold after a long flirtation with the bearish trend. Gold-backed ETF holdings rose about three metric tons on Tuesday, according to Sharps Pixley, the first increase after 11 days of decline. Year-to-date, ETF holdings have dropped about 26 percent to 1,935 metric tons, however, keeping the longer-term declining trend intact. As Sharps Pixley notes, however, Chinese consumers have apparently accumulated more than twice the amount of the outflow from the SPDR gold ETF.
Indeed, as recent gold commentators are quick to point out, Chinese house wives evidently know something about the future gold outlook that Goldman Sachs doesn't. Chinese consumers have retained their relentless hunger for physical gold despite the major setbacks suffered by the yellow metal this year. Will the Chinese investor be justified in the end, or do the investment banks like Goldman have the correct long view on the metal? Time will ultimately reveal the truth, but for now conservative traders are advised to remain in gold's immediate shadow via the 15-day moving average and the relative strength indicator.
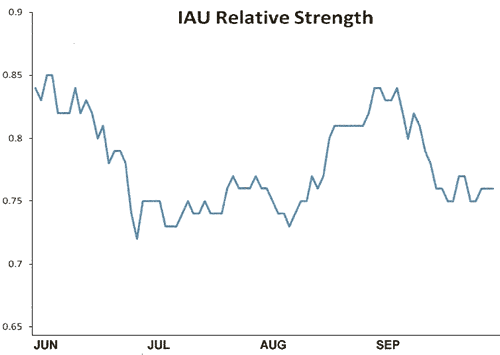
Speaking of gold's relative strength, the RS indicator for the iShares Gold Trust (IAU), our favorite gold proxy, hasn't given us any new buy signals. It's pretty much in line with the price line of the IAU and is technically neutral. Conservative traders might wait for the relative strength line to turn up before taking on any new commitments in IAU.

Stock Market Cycles
Take a journey with me as we uncover the yearly Kress cycles - the keys to unlocking long-term stock price movement and economic performance. The book The Stock Market Cycles covers each one of the yearly cycles in the Kress Cycle series, starting with the 2-year cycle and ending with the 120-year Grand Super Cycle.
The book also covers the K Wave and the effects of long-term inflation/deflation that these cycles exert over stock prices and the economy. Each chapter contains illustrations that show exactly how the yearly cycles influenced stock market performance and explains where the peaks and troughs of each cycle are located and how the cycles can predict future market and economic performance. Also described in this original book is how the Kress Cycles influence popular culture and political trends, as well as why wars are started and when they can be expected based on the Kress Cycle time line.
Order today and receive an autographed copy along with a copy of the booklet, "The Best Long-Term Moving Averages." Your order also includes a FREE 1-month trial subscription to the Momentum Strategies Report newsletter: http://clifdroke.com/books/Stock_Market.html
By Clif Droke
www.clifdroke.com
Clif Droke is the editor of the daily Gold & Silver Stock Report. Published daily since 2002, the report provides forecasts and analysis of the leading gold, silver, uranium and energy stocks from a short-term technical standpoint. He is also the author of numerous books, including 'How to Read Chart Patterns for Greater Profits.' For more information visit www.clifdroke.com
Clif Droke Archive |
© 2005-2022 http://www.MarketOracle.co.uk - The Market Oracle is a FREE Daily Financial Markets Analysis & Forecasting online publication.


