


Fed Decision Speeds Up Stock Market Topping Action
Stock-Markets / Stock Markets 2013 Sep 23, 2013 - 06:38 AM GMTBy: Andre_Gratian

 Current Position of the Market
SPX: Very Long-term trend - The very-long-term cycles are in their down phases, and if they make their lows when expected (after this bull market is over), there will be another steep decline into late 2014. However, the severe correction of 2007-2009 may have curtailed the full downward pressure potential of the 40-yr and 120-yr cycles.
Intermediate trend - SPX has made a new high after ending its correction at 1627. It still has a little way to go to reach its current intermediate top.
Analysis of the short-term trend is done on a daily basis with the help of hourly charts. It is an important adjunct to the analysis of daily and weekly charts which discusses the course of longer market trends.
FED DECISION SPEEDS UP TOPPING ACTION
Market Overview
Many analysts, (including myself) had expected wave C of the previous corrective pattern to decline beyond 1627. However, it soon became clear that this is where the major wave 4 ended and major 5 started. First, Larry Summers decision to withdraw from consideration as the next Fed chairman, and then, a few days later, the Feds decision not to start tapering their bond purchases, sent indices to a new high. By Friday, it looked very much as if wave 3 of major 5 had already been reached and wave 4 correction was underway. Undoubtedly, prior knowledge that these two news items would soon surface cut the correction short. At the same time, this market action has also shortened the arrival of the next important peak.
Based on P&F projections, I had expected some sort of a top at 1734, but it came a few points early at 1729.86. That poses an interesting question: "Was that a wave 3 failure to reach its projection, or will 1734 turn out to be the high point of major 5?" The market action should give us a clue by the way it approaches 1734 after the current pull-back is over. If it is a sluggish move, that could very well be the top of 5, followed by the next intermediate decline (primary IV).
The negatives pointed out in the last letter are still there, in spite of the fact that the market has surged to new highs. But from a pure technical standpoint, it should take several more days for the daily indicators to give a bona fide sell signal - unless the recent top turns out to be the completion of major 5 (as some EW analysts believe). In that case, we would expect the correction which started Friday to continue instead of completing a few points lower over the next day or two.
Next week will give us the answer!
Chart Analysis
This week well start with an analysis of the weekly SPX chart (courtesy of QChart), which is showing signs of maturity, but as long as it is making higher highs and higher lows, it is still in an uptrend.
I have encased two major trends in channels which also show that the uptrend is still alive, though aging. The green channel starts at the beginning of the bull market and shows that it is still very much intact. There is not even the slightest sign of challenging the bottom channel line. On the contrary, it is still trying to reach the top of the channel.
The secondary trend is defined by the blue channel. It, too, appears to be still relatively healthy - that is until we start looking at what the indicators are saying! The move within the green channel developed in two intermediate trends. I show only the end of the first one on this chart. It ended in April 2011 and was followed by the largest correction of the entire bull market.
Turning to the MACD, I am again bringing your attention to the pattern which was made by this indicator and its histogram at the end of the first intermediate trend: a pattern which gave ample warning about the impending correction. The histogram went negative at the blue arrow, approximately 8 weeks before the high of the move. Looking at the current formation, the histogram went negative about 13 weeks ago, although it did have a brief rally into the green before turning red again, which was 6 weeks ago. We would not expect the two patterns to be exactly alike, but this is clearly a warning that long-term momentum is being lost -- a precursor to an important reversal.
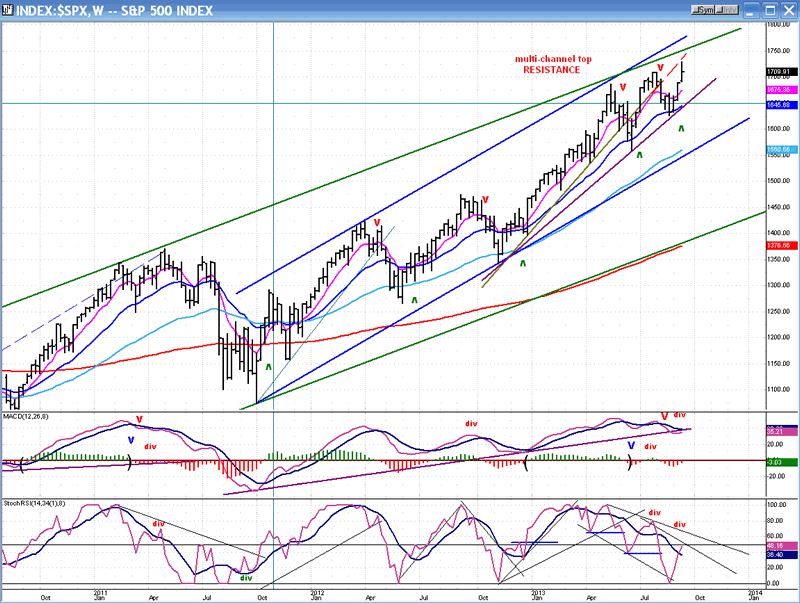
We see a similarity of patterns in the MACD itself. Both reached the same height before starting to roll over. The first one tried to resist the downtrend for a little while, but then gave up when the price broke and soon after turned negative. Because of this continuing similarity, it would be logical to expect the current formation to end in the same manner, with acceleration below the zero line as prices break.
The lower index (SRSI) is making an even more negative pattern, but then, it always leads the MACD when warning of a market turn. When SPX was still making higher highs and lows, it was doing the opposite and on its last down-thrust it turned negative. This formation is also very similar to the one it exhibited prior to the last major correction which warned that the end of the uptrend was not far away. Lets now turn to the daily chart to see if it sheds some light on when that will be.
Instead of concerning ourselves with channels lets observe the green trend line from 1343 that has now three points where it was touched by the SPX. That makes is a very reliable trend line which, when broken, should lead to a significant decline because of its length.
But we should not have to wait until the break to know that a major downtrend is underway. You will notice that the two lower indicators have already turned down while the MACD is still thinking about it. It is the only indicator where the two MAs have not crossed. But all three indicators are still positive. The last two reversal signals came when they went negative and the MACD lines crossed. We are not quite there yet.
The fact that there is still a little time fits in with the earlier mention that we may need one more wave on the upside to complete the structure, either as a move back to 1734, or a move past it. In that case, I would have to come up with another price target for the end of this move.
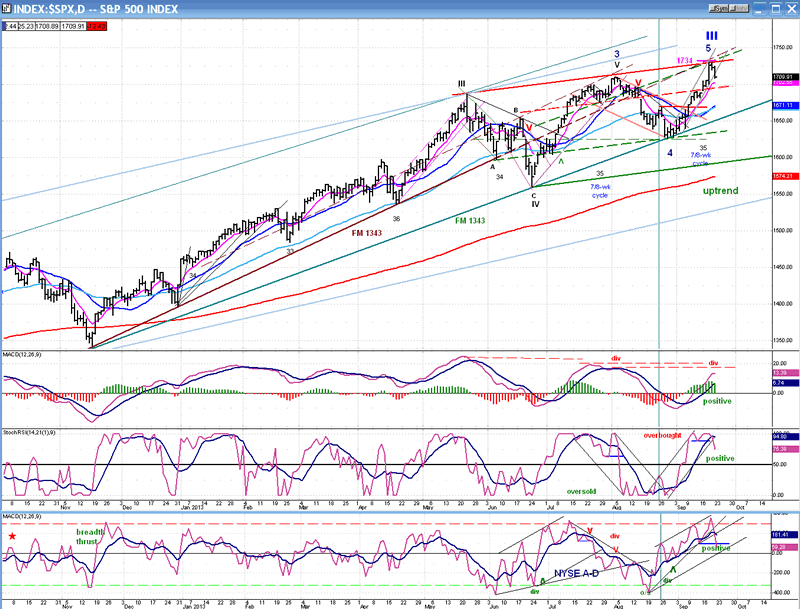
And, we must keep in mind the possibility that this Fed-caused rally was a final blow-off, especially since an exhaustion gap (not shown on the above chart) might have been created on Wednesday which is now in the process of being filled. If this short-term correction does not stop soon, or stops for a while and then resumes the downtrend, we will have to consider the possibility that major wave 5 ended at 1730. Just watch the indicators for confirmation!
Cycles
The low of the 7/8-wk cycle was neutralized and cut short by the Larry Summers announcement, and it only managed to create a sideways move before turning up sharply.
An 18-wk cycle bottoming in the second half of October could affect prices adversely after wave 5 has topped.
Breadth
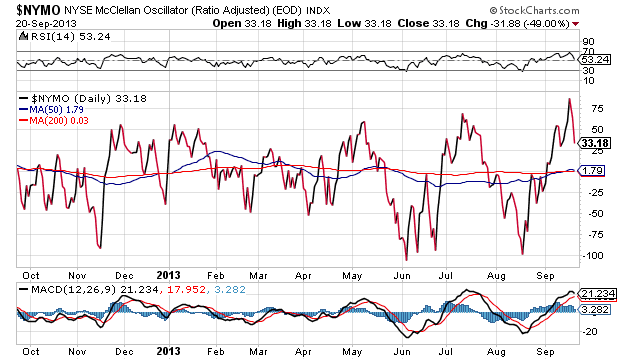
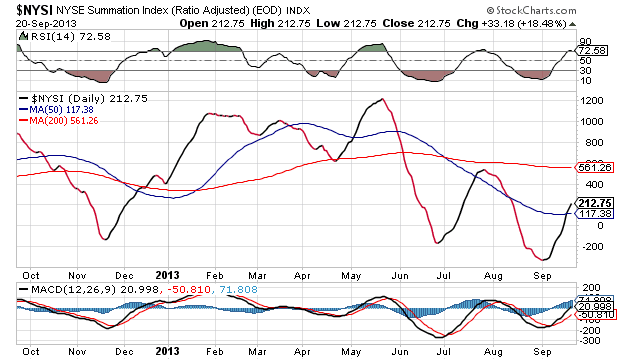
The McClellan Oscillator and Summation Index appear below (courtesy of StockCharts.com).
The McClellan oscillator has gone quickly from oversold to overbought and has started to correct. The velocity with which it corrects will determine whether we have already made a top or if there is more work to do above the zero line -- including meaningful negative divergence developing against price -- before the high of the move is reached.
The NYSI is telling us that its not so much a question of if but when the market reverses. It is increasing its negative divergence to the price on a longer-term basis, and this shows there is a severe loss of breadth momentum (an important red flag) is taking place.
Sentiment Indicators
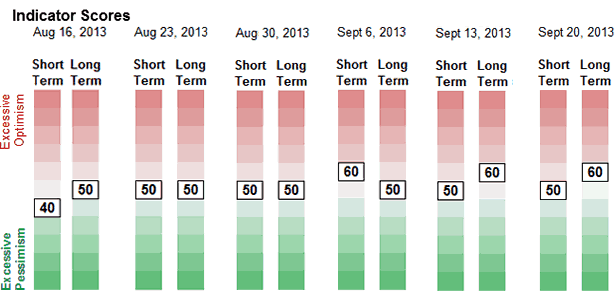
The SentimenTrader (courtesy of same) indicator scores remain the same as last weeks. A reading of 60 for the long term indicator was all that was needed to signal the last market top. It may also be good enough for the coming market high, but for the end of the bull market, it will probably require a higher number. Well see!
VIX
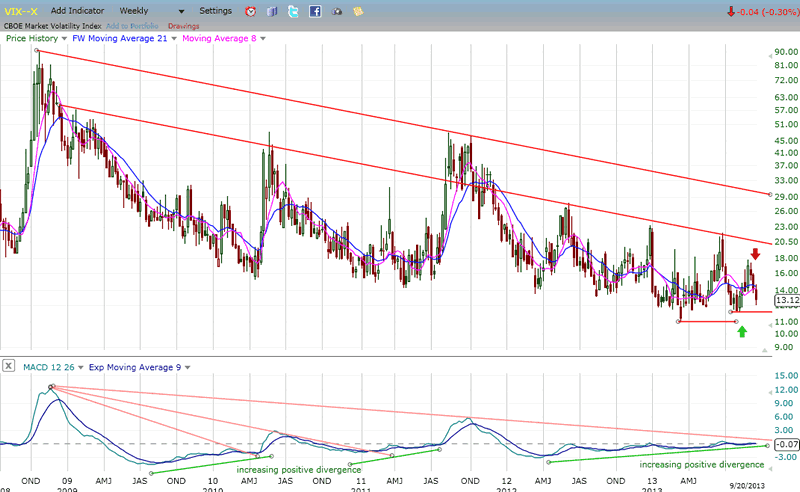
This is a long-term chart of VIX which goes back to the beginning of the bull market. Since the mid-point of the bull market, when the deepest correction of the entire bull run sent the VIX to a high of about 45, it has been making a series of lower highs as the market rose higher and higher. In the early stages of this second phase, it was also making lower lows inversely to the market trend. In early August this pattern began to change. The August high in the market did not bring a lower low in VIX and, although SPX made another all-time high last week, VIX looks intent on making a higher low once again. Undoubtedly, this is a warning similar to what the weekly indicators (above) are saying: "CAUTION! A major reversal is near!"
XLF (Financial Index)
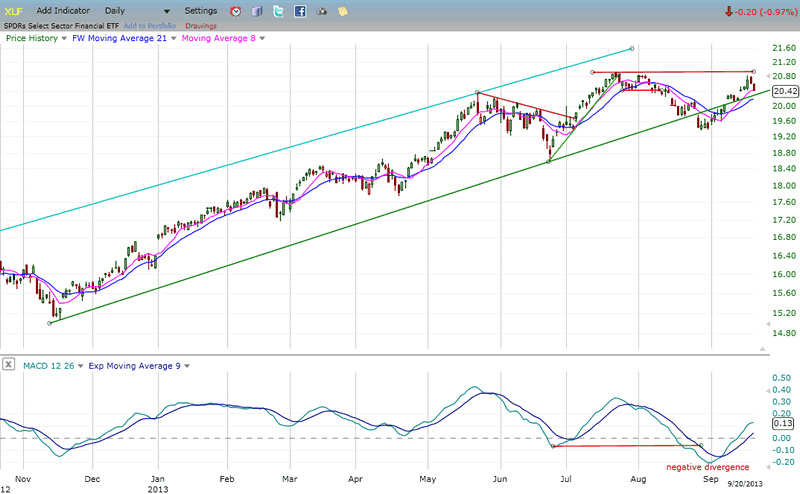
XLF continues to show relative weakness to SPX. The latter made an all-time high last week but XLF did not, and barely got back above its broken intermediate trend line. If it resumes its decline from here by breaking its trend line one more time, it will be another warning for the bulls.
The MACD is already making a very negative pattern. Under these technical circumstances, it is not conceivable that XLF could re-gain its uptrend in short order.
BONDS
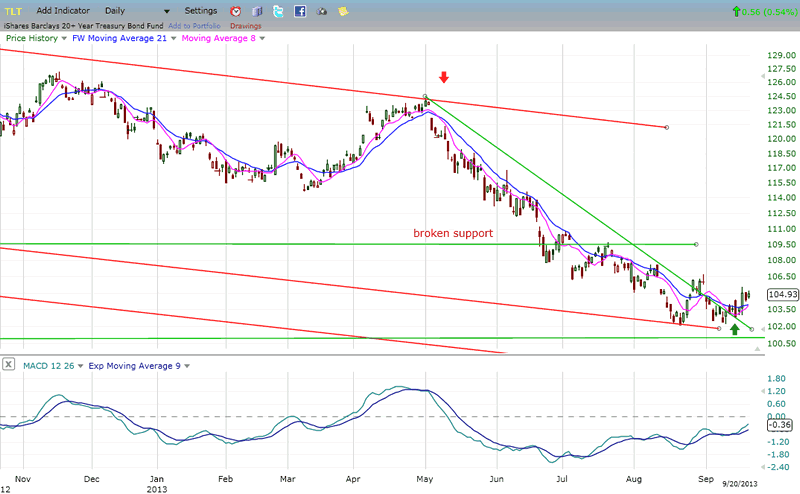
TLT is finally showing its willingness to halt its steady downtrend. It first found support on a secondary channel line, bounced, and has now re-tested it (apparently) successfully. If it can rise above its recent short-term high, it will be back in a rally -- but only a rally in a downtrend -- which could end at the former broken support line.
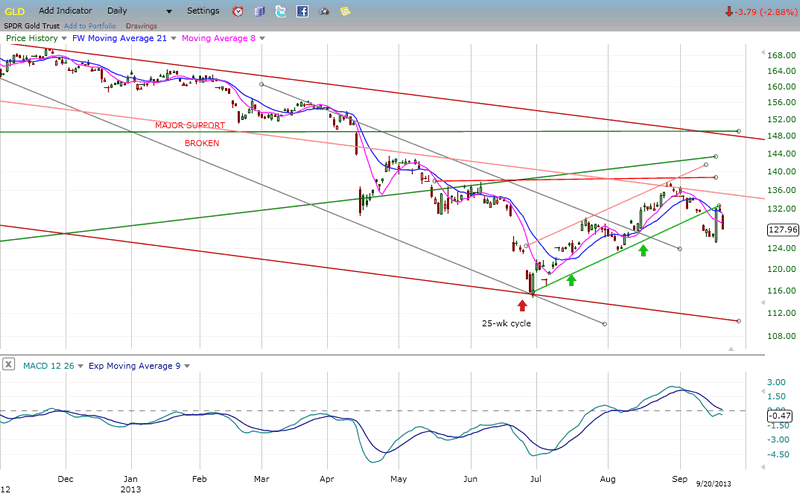
GLD (ETF for gold)
GLD had a good oversold rally which started when its last 25-wk cycle turned up. This took the price up to a predictable resistance level and then GLD started down again. A short-covering rally moved it up 5 points on the day that the Fed announced no taper. Since then, it has started to weaken again. It could try to extend its bounce, but since the cycle already seems to have rolled over, it may not get very far. There is an unfilled projection to 110 which could turn out to be an important low.
UUP (dollar ETF)
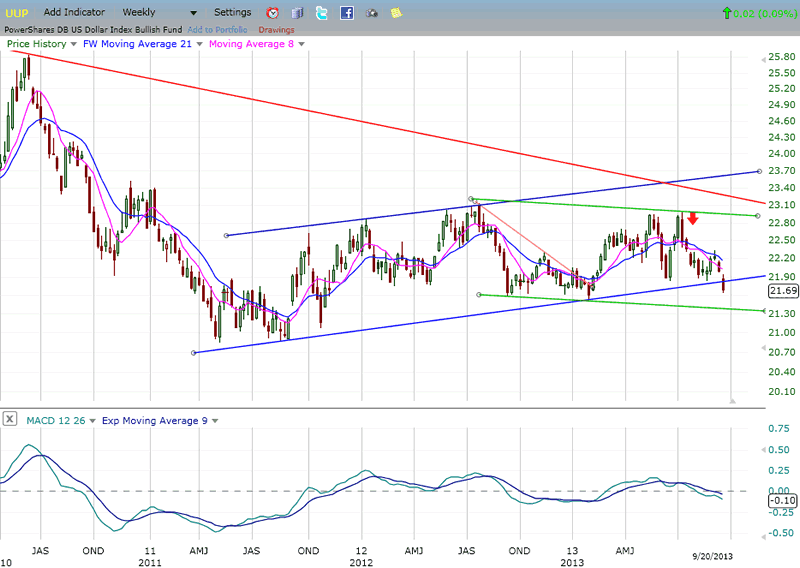
UUP is at an important juncture. There is a good possibility that breaking below its intermediate trend line will turn out to be a false break, but it will have to return inside its channel quickly for that to be the case. The longer it remains below its blue channel line, and the deeper it continues its correction, the more negative the technical picture will become.
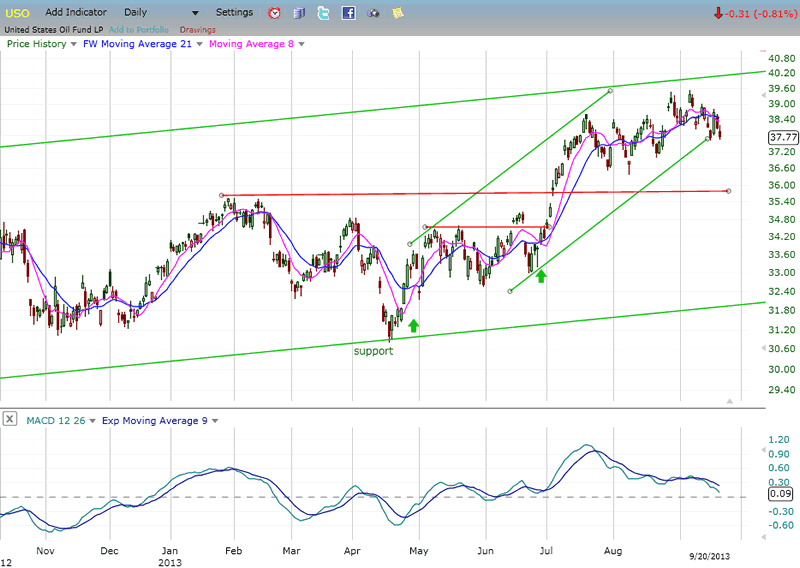
USO (United States Oil Fund)
USO has completed its short-term up-phase and is ready to correct. It is already challenging its lower channel line and is expected to break it. The MACD is showing significant negative divergence and is about to turn negative.
A move down to the red support line is likely.
Summary
SPX is close to an important inflection point. After the completion of the short-term decline which is underway, It is possible that it will make a new high before having a significant correction. However, failure to rise above 1734 and beginning to turn down again could signal an early reversal.
FREE TRIAL SUBSCRIPTON
If precision in market timing for all time framesis something that you find important, you should
Consider taking a trial subscription to my service. It is free, and you will have four weeks to evaluate its worth. It embodies many years of research with the eventual goal of understanding as perfectly as possible how the market functions. I believe that I have achieved this goal.
For a FREE 4-week trial, Send an email to: ajg@cybertrails.com
For further subscription options, payment plans, and for important general information, I encourage
you to visit my website at www.marketurningpoints.com. It contains summaries of my background, my
investment and trading strategies, and my unique method of intra-day communication with
subscribers. I have also started an archive of former newsletters so that you can not only evaluate past performance, but also be aware of the increasing accuracy of forecasts.
Disclaimer - The above comments about the financial markets are based purely on what I consider to be sound technical analysis principles uncompromised by fundamental considerations. They represent my own opinion and are not meant to be construed as trading or investment advice, but are offered as an analytical point of view which might be of interest to those who follow stock market cycles and technical analysis.
Andre Gratian Archive |
© 2005-2022 http://www.MarketOracle.co.uk - The Market Oracle is a FREE Daily Financial Markets Analysis & Forecasting online publication.