


Stock Market Ready for Wave C Decline?
Stock-Markets / Stock Markets 2013 Sep 09, 2013 - 07:26 AM GMTBy: Andre_Gratian

 Current Position of the Market
SPX: Very Long-term trend - The very-long-term cycles are in their down phases, and if they make their lows when expected (after this bull market is over), there will be another steep decline into late 2014. However, the severe correction of 2007-2009 may have curtailed the full downward pressure potential of the 40-yr and 120-yr cycles.
Intermediate trend - SPX and some other indices have formed a H&S top which was confirmed with last week's sell-off. An intermediate term correction is under way.
Analysis of the short-term trend is done on a daily basis with the help of hourly charts. It is an important adjunct to the analysis of daily and weekly charts which discusses the course of longer market trends.
READY FOR WAVE C?
Market Overview
After completing a 5-wave pattern down to its 1627/1630 phase projection, SPX began a laborious rally which was clearly corrective in nature. By Friday, it had retraced to its 55-DMA (which happens to coincide with the 233-hr MA). This re-bound also amounts to a little more than one third of the decline from the top. This is a high resistance level which could put an end to the counter-trend rally, but if it is overcome, another 15 to 20 points on the upside would not be surprising.
We had expected that the correction would unfold in a three-wave pattern. So far, it looks as if wave A completed at the 1627 level and wave B may very well have ended on Friday, at 1664. If so, the decline should resume -- most likely in another 5-wave pattern - probably bringing the correction to an end after it is complete. The bears should get some assistance from a cycle which is due to make its low toward the end of next week.
The amount of distribution that took place at the head & shoulder top is capable of producing much lower projections -- all the way down to the low 1500s if a count is taken across the entire pattern. While the correction may not reach these levels, it would not be unusual if it did since this is a major wave 3 correction.
Sentiment continues to be essentially neutral and in keeping with a correction which has more to go. It is likely that we will see a higher degree of pessimism by the time it comes to an end.
Chart Analysis
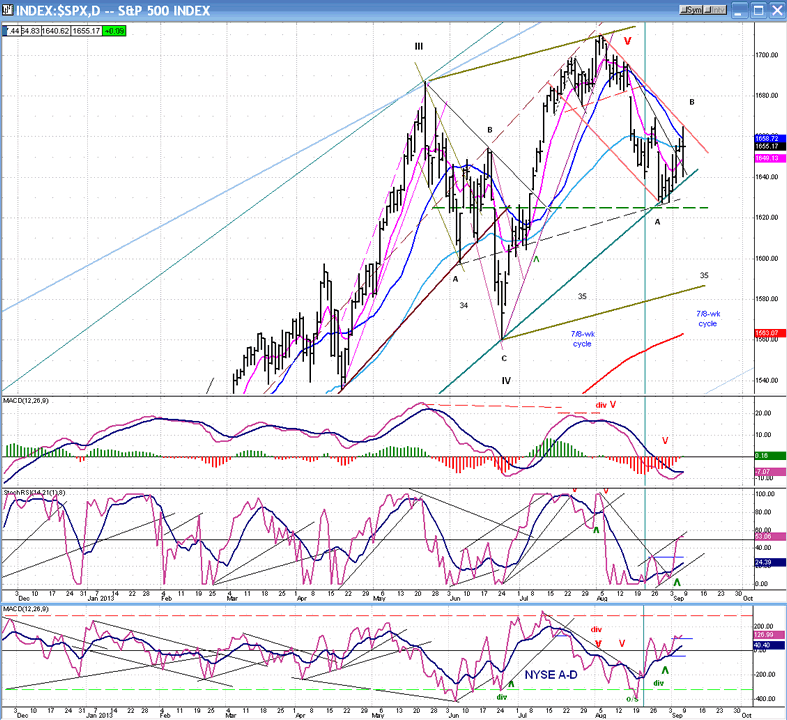
Let's analyze the daily SPX chart (courtesy of QChart).
It is easy to see why SPX found support at the 1630 level. Besides its being a P&F phase projection, look at the support which existed at that level: multiple trend line and channel support, the most important of which being a major trend line from 1343. The breaking of that trend line should signal the resumption of the intermediate decline.
But is that trend line ready to give way? We'll find out next week! The daily indicators are still in an uptrend and, although they showed some hesitation on Friday, it will require nothing less than a complete rolling over and going negative to generate a sell signal. The base that was created at the 1630 level gave us a phase count which was essentially filled at the 1664 level on Friday. But there is also another valid count some 15 points higher which may or may not be reached, depending on how much weakness can be generated by the cycle bottoming toward the end of the week.
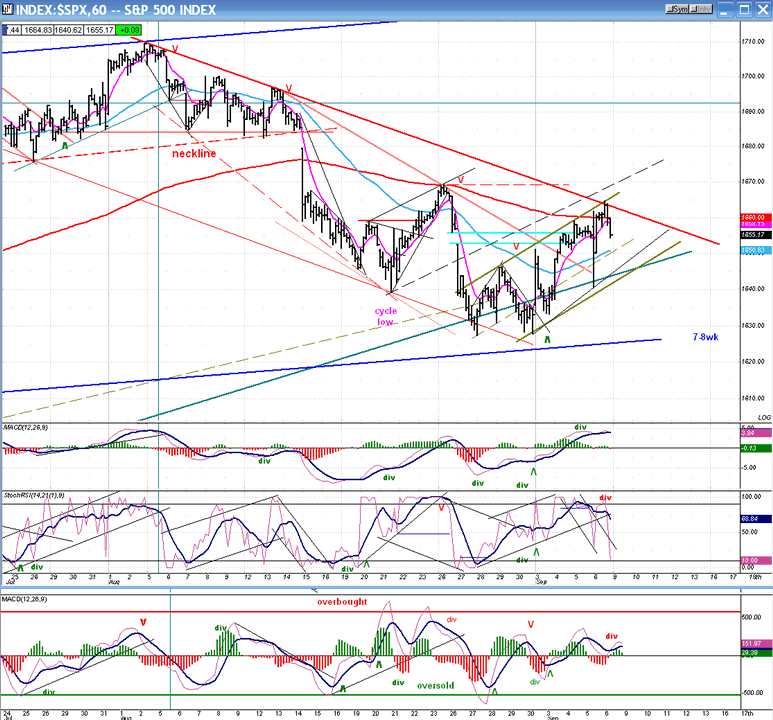
The hourly chart is giving us strong indications that an hourly sell signal may have been given on Friday. Should this be the case, it could lead to the daily indicators entering a sell mode as well. On Friday, the SPX reached the top of its corrective channel as well as its 233-hr MA. That was enough resistance to cause it to pull back from a short-term overbought condition in both price and indicators, especially since the latter had developed some negative divergence. But note that there is no price deceleration showing at the top of the move, which could mean that a short-term correction could remain confined to the green up-channel, followed by another attempt a breaking through the red downtrend line. By the time the SPX reaches the bottom of its green channel, it will have corrected about 25 points and could be ready to turn up again.
During Friday's volatile session, the index dropped down to 1640 before finding support and staging a strong rebound which took it to a new high. 1640 is also the current level of the major trend line from 1343 -- the trend line which must be broken before we can continue the longer-term correction. If SPX reaches that level with its hourly indicators in an oversold condition and stabilizes, it will be an indication that it may be ready to extend its counter-trend rally. But if it turns down again before reaching the main (red) downtrend line, new lows could soon follow. Next week should be a very interesting and decisive week.
Cycles
The 7/8-wk cycle is due toward the end of next week and should be instrumental in helping the SPX to re-test its recent lows. Any attempt at holding above the main trend line will be a sign of strength, suggesting that the counter-trend rally is still alive.
Breadth
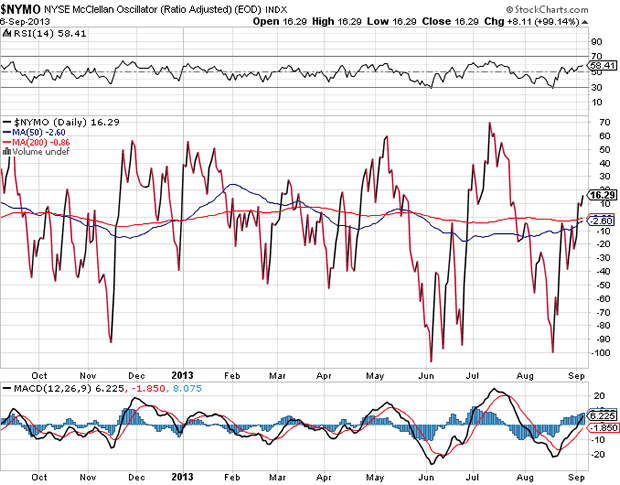
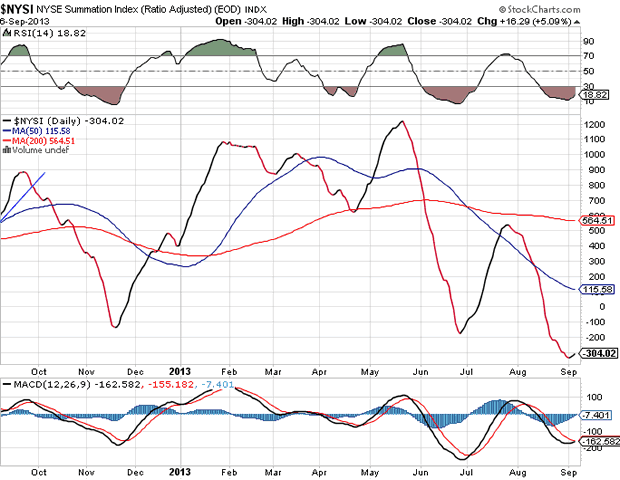
The McClellan Oscillator and Summation Index appear below (courtesy of StockCharts.com).
The McClellan indicator has rallied from an oversold condition to slightly above the zero line. This has barely turned the NYSI which is still deeply negative. However, the NYSI indicators are all showing positive divergence, which means ... probably nothing, in the sense that it is not necessarily a sign that the market correction is close to being over.
Sentiment Indicators
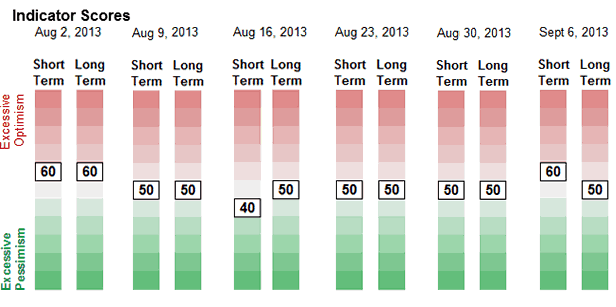
The long term indicator of the SentimenTrader (courtesy of same) continues to show a neutral figure. The short term reading of 60 is slightly elevated and consistent with the overbought hourly market condition, indicating that a pull-back may have started on Friday (which could turn out to be the resumption of the intermediate correction).
VIX
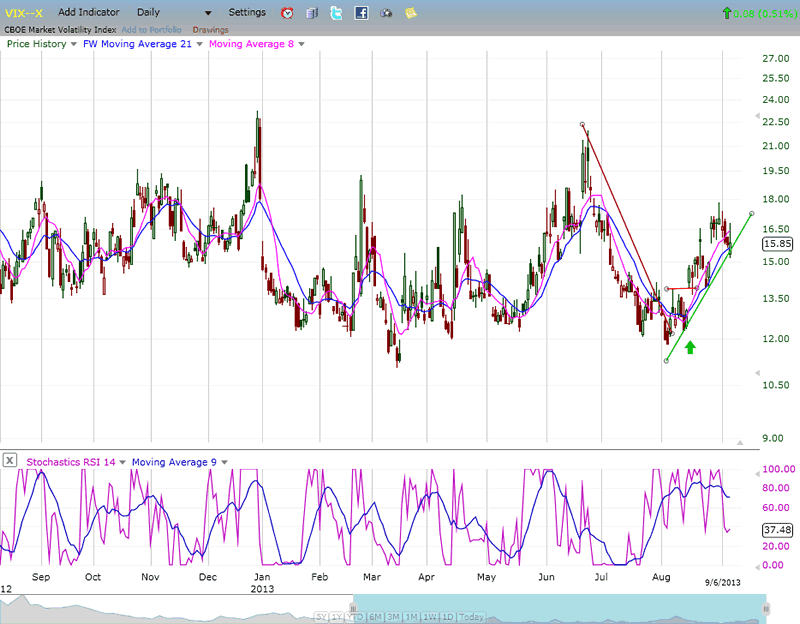
VIX barely pulled-back during the time that the SPX rallied from the 1630 level. This is an indication that the market's intermediate correction is probably still in effect. If VIX breaks below 14, we would have to consider the possibility that the correction is over.
XLF (Financial Index)
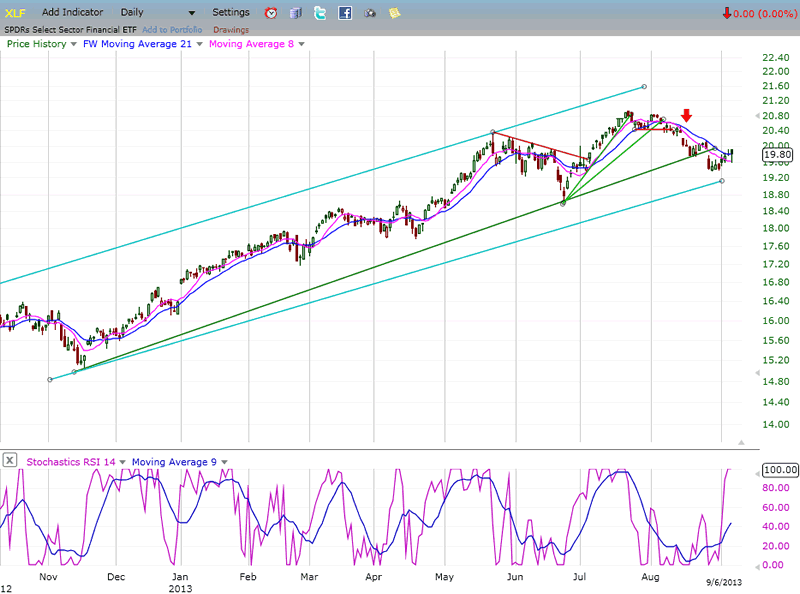
XLF continues to show relative weakness to the SPX. It has broken its long-term trend line from November, while SPX remains above it. Any further weakness which would take it outside of its light blue channel would be a sign that the intermediate decline has resumed. It is likely that the end of the correction will be preceded by some relative strength developing in XLF vs. SPX.
BONDS
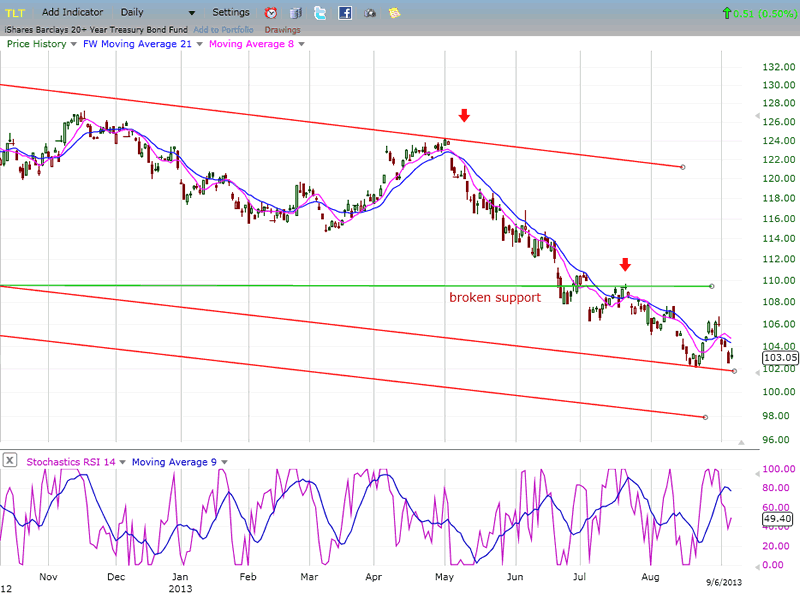
TLT may have found some temporary support at the bottom of a wide down-channel. After a bounce, it is in the process of re-testing it. Should that be successful, a rally in a long-term downtrend would be expected to develop, but nothing that would threaten to become a significant reversal.
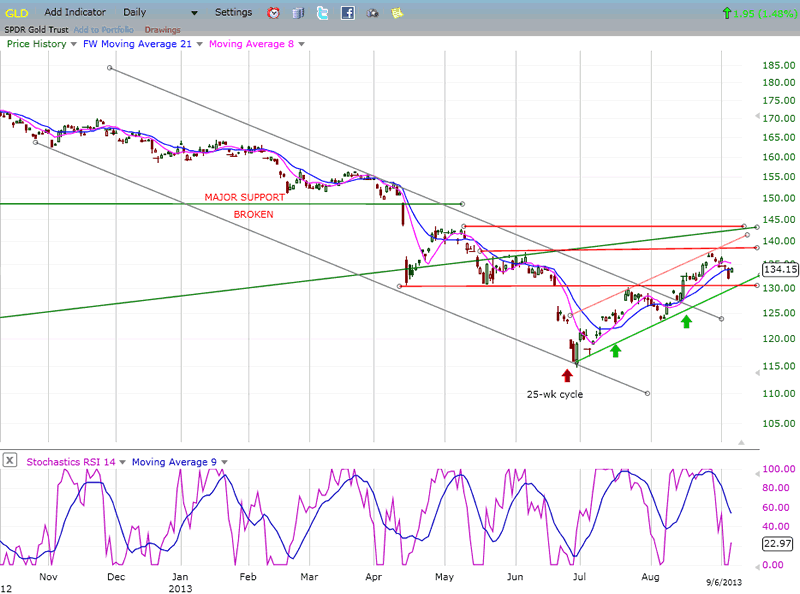
GLD (ETF for gold)
GLD was very oversold when it reached the bottom of its 25-wk cycle, and it had a good rally which was initially stopped by the first level of overhead resistance. Subsequently, the index managed to overcome that layer and move to the top of the second band of resistance which also halted its progress. It is unlikely that GLD will be able to move much higher before developing more of a base.
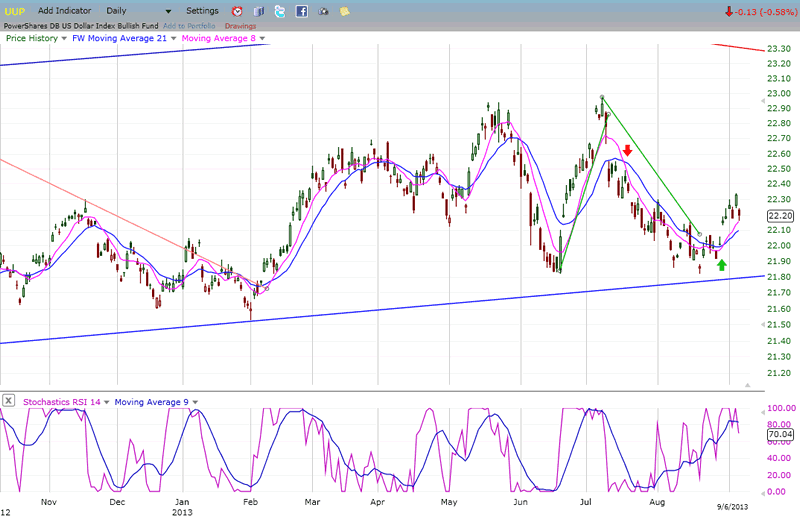
UUP (dollar ETF)
Once again, UUP found support at the bottom of its broader channel, and bounced. It is trying to establish a short-term uptrend which could get some assistance from the Fed if it decides to cut back on its bond purchases this month.
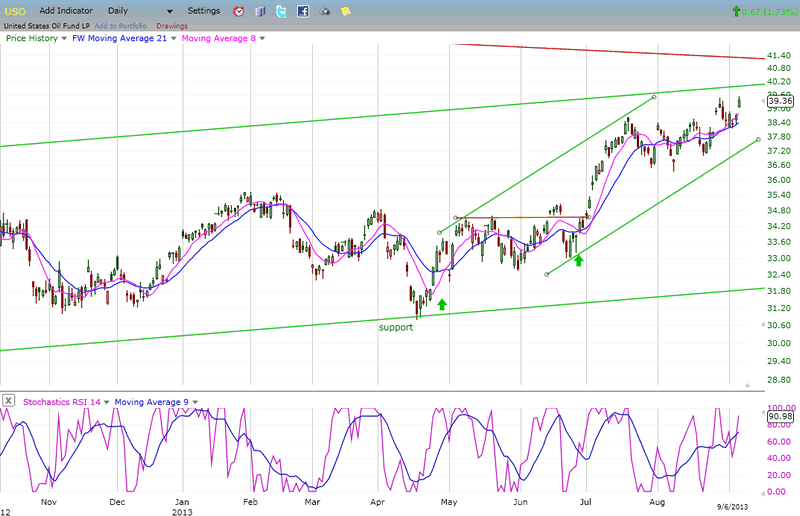
USO (United States Oil Fund)
USO did extend its rally after a short consolidation, However, having apparently (almost) completed a 5-wave pattern from 31, and having arrived at the top of its channel with some negative divergence beginning to show in its indicator, it may be ready to undergo some additional consolidation.
Summary
It has become more certain that the support that SPX found at 1630 represents the A point of the expected A-B-C intermediate correction. However, it is much less certain that Friday's high marks the completion of the B wave -- although it could be. While some technical factors point to that possibility, that's all it is until confirmation is established.
I am fairly confident that by the end of next week we should be much more ready to decide if wave C has already started or if it still ahead of us.
FREE TRIAL SUBSCRIPTON
If precision in market timing for all time framesis something that you find important, you should
Consider taking a trial subscription to my service. It is free, and you will have four weeks to evaluate its worth. It embodies many years of research with the eventual goal of understanding as perfectly as possible how the market functions. I believe that I have achieved this goal.
For a FREE 4-week trial, Send an email to: ajg@cybertrails.com
For further subscription options, payment plans, and for important general information, I encourage
you to visit my website at www.marketurningpoints.com. It contains summaries of my background, my
investment and trading strategies, and my unique method of intra-day communication with
subscribers. I have also started an archive of former newsletters so that you can not only evaluate past performance, but also be aware of the increasing accuracy of forecasts.
Disclaimer - The above comments about the financial markets are based purely on what I consider to be sound technical analysis principles uncompromised by fundamental considerations. They represent my own opinion and are not meant to be construed as trading or investment advice, but are offered as an analytical point of view which might be of interest to those who follow stock market cycles and technical analysis.
Andre Gratian Archive |
© 2005-2022 http://www.MarketOracle.co.uk - The Market Oracle is a FREE Daily Financial Markets Analysis & Forecasting online publication.