


Gold and Silver Stocks No Retest of June Lows
Commodities / Gold and Silver Stocks 2013 Sep 06, 2013 - 12:46 PM GMTBy: Jordan_Roy_Byrne

 Recently I’ve received some emails from those who are concerned about a retest of the June low in the precious metals complex. That prompted me to look at how rebounds develop from significant bottoms. In recent months we focused on historical bottoms in gold stocks and it helped us to pinpoint the best buying opportunities. In this editorial we broaden the scope and examine how certain bottoms play out and why they play out in a particular manner. The length and depth of the preceding bear market helps us to understand how the ensuing bull market evolves during its initial rebound.
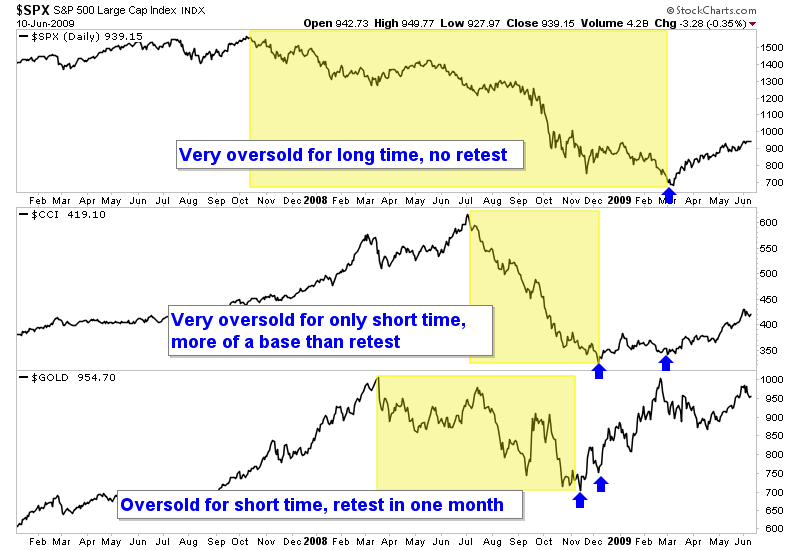
Below is a chart that shows the S&P 500, CCI (commodities) and Gold from 2007 through 2009. The S&P 500 declined for nearly 18 months without any major rallies. It was extremely oversold and enjoyed a V bottom. The March bottom was actually somewhat a retest of the November low though it did form a new low. Meanwhile, commodities were very oversold but for only a short period of time. Therefore, after the market bottomed it “based” for about four months before accelerating. (This is somewhat similar to what occurred following the 1987 stock market crash). Gold was oversold but only for a short period of time. Its bottom took a few weeks to form and then within a month had a retest.
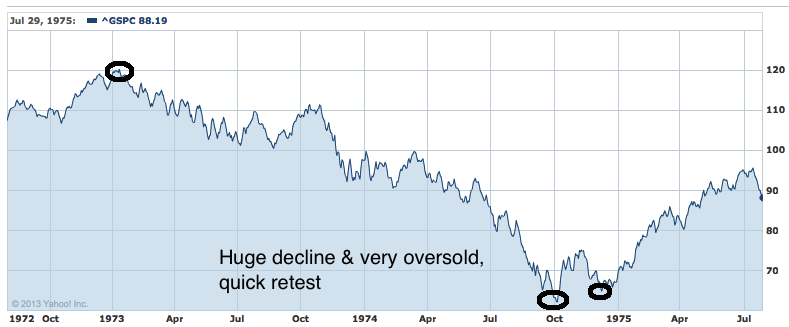
Next, look at the 1974 bottom in the S&P 500. The market was cut in half over more than an 18-month period. It was very oversold and oversold for a long period of time. The retest occurred within two months of the bottom and then the rebound accelerated.
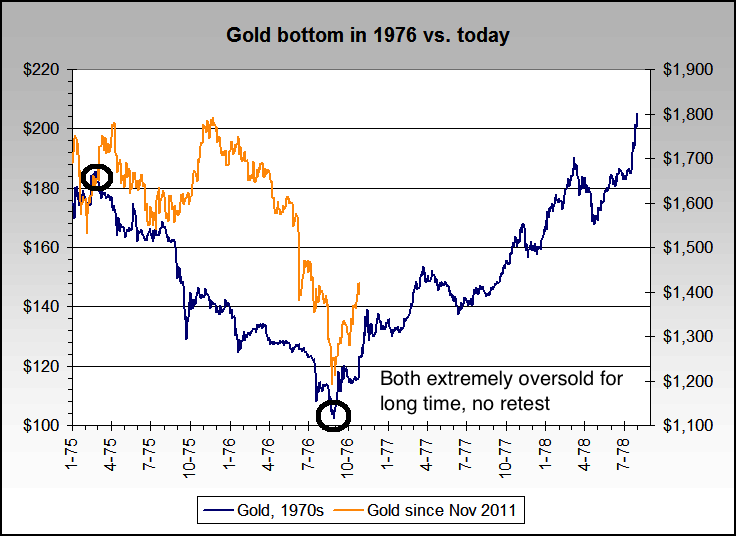
The chart below (from nowandfutures.com) plots Gold from today with Gold from 1975-1976. Back then Gold declined by nearly 45% and over an 18-month period. Gold was extremely oversold and oversold for an extended period of time. That could be why Gold didn’t have a retest. This time around Gold was in a similar position. It declined over 35% over a 20-month period but has since rebounded over $200/oz. It’s not a coincidence that the two rebounds occurred without a retest.
These studies provide great examples and a great education with regards to post-bottom price action. Here is our interpretation. If a market is extremely oversold and has declined for a long period of time then it is more likely to have a V-type bottom. If a retest doesn’t occur (in this case) within two months then the bottom is most likely in. If a market is extremely oversold but has only declined for a short period of time (1987 crash, 2008 crash) then a base building process (or two steps forward, one step back) should be expected over the coming weeks.
If a market is extremely oversold for an extended period of time then the selling has been exhausted, therefore leaving little resistance to the rebound. This explains the V bottom. Conversely, if a market hasn’t been oversold for an extended period then there are still some sellers that come in after the bottom and slow down the rebound.
It’s been two months since the bottom in precious metals and the sector remains comfortably above its lows. Silver is still $5/oz above its lows while Gold is nearly $200/oz above its lows. It’s too late to expect a retest of the lows. In fact, the miners already tested their lows in early August which was five weeks after the bottom. Given what we’ve studied, the severity of the 2011-2013 cyclical bear market, and the recent strong rebound, there is no compelling reason to expect a retest or any major decline.
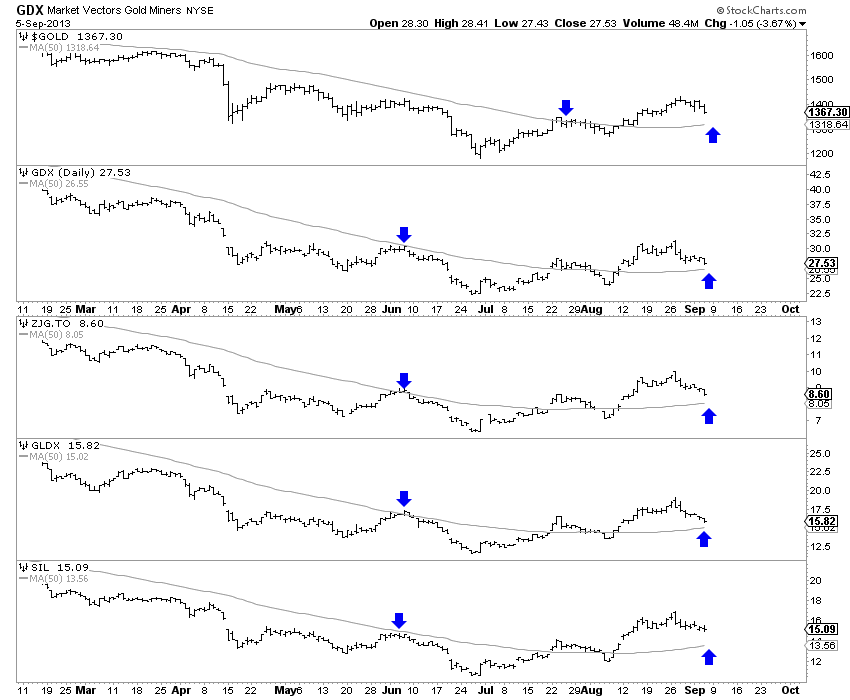
The chart below plots Gold as well as various miner ETFs with arrows emphasizing the 50-day moving averages.
Last week we wrote:
The bottom line is the current correction or consolidation is quite healthy for the sector. Many stocks have made huge runs in a very short period of time and are set to digest those gains and correct short-term overbought conditions. Be patient over the coming days and weeks and use the 50-dma as a guide for support and potential lows.
The above chart shows that gold and silver stocks of all stripes are quite close to testing the now upward sloping 50-day moving averages. We should see a test of that support over the next few days. Don’t fret over recent weakness as its an opportunity. If you are kicking yourself for not buying the June or August lows, then you may get another chance very soon.
If you'd be interested in professional guidance in this endeavor, then we invite you to learn more about our service.
Good Luck!
Bio: Jordan Roy-Byrne, CMT is a Chartered Market Technician, a member of the Market Technicians Association and from 2010-2013 an official contributor to the CME Group, the largest futures exchange in the world. He is the publisher and editor of TheDailyGold Premium, a publication which emphaszies market timing and stock selection for the sophisticated investor. Jordan's work has been featured in CNBC, Barrons, Financial Times Alphaville, and his editorials are regularly published in 321gold, Gold-Eagle, FinancialSense, GoldSeek, Kitco and Yahoo Finance. He is quoted regularly in Barrons. Jordan was a speaker at PDAC 2012, the largest mining conference in the world.
Jordan Roy-Byrne Archive |
© 2005-2022 http://www.MarketOracle.co.uk - The Market Oracle is a FREE Daily Financial Markets Analysis & Forecasting online publication.