


Ring-Fence the Bad Assets- Re-Arranging the Deck Chairs on the Titanic?
Economics / US Economy Apr 05, 2008 - 07:49 PM GMTBy: Paul_L_Kasriel

 Yesterday I expressed my opinion on the lack of economic substance of allowing financial institutions to value the assets on their books at historical cost or whatever they so desire ( Mark It as You Choose, but Is Enough Cash Coming In? ). Today, yet another "costless" solution to the bad-asset problem is being put forth in the Financial Times - quarantine the bad apples from the good ( Wall St banks seek to ring-fence bad assets ).
,br>
Simply isolating the bad assets does not make them "good." Selling the isolated bad assets in an arms-length transaction to some other private entity presumably results in a loss for the seller. If not, why are they considered bad assets? Selling the isolated bad assets to some government entity at some price above an arms-length transaction shifts the loss from the selling institution to the taxpayers. When will the modern-day alchemists face up to the fact that they have lead, not gold, on their balance sheets, take their losses and move on?
Jobless Claims - If One Week Does Not a Trend Make, How about 4 Weeks?
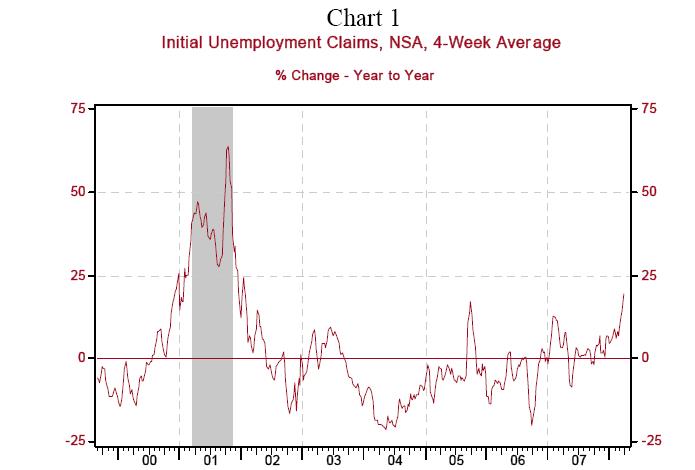
Initial jobless claims soared upward by 38 thousand in the week ended March 29. Maybe the moveable feast of Easter played havoc with the seasonal adjustment factor. Maybe a strike in the auto-equipment sector biased upward new unemployment claims. So, lets look at 4-week moving averages of not-seasonally-adjusted initial claims and compare them with year-ago data. Chart 1 shows that the year-over-year rate of increase in initial jobless claims is picking up speed - hitting 19.5% in the four weeks ended March 29.
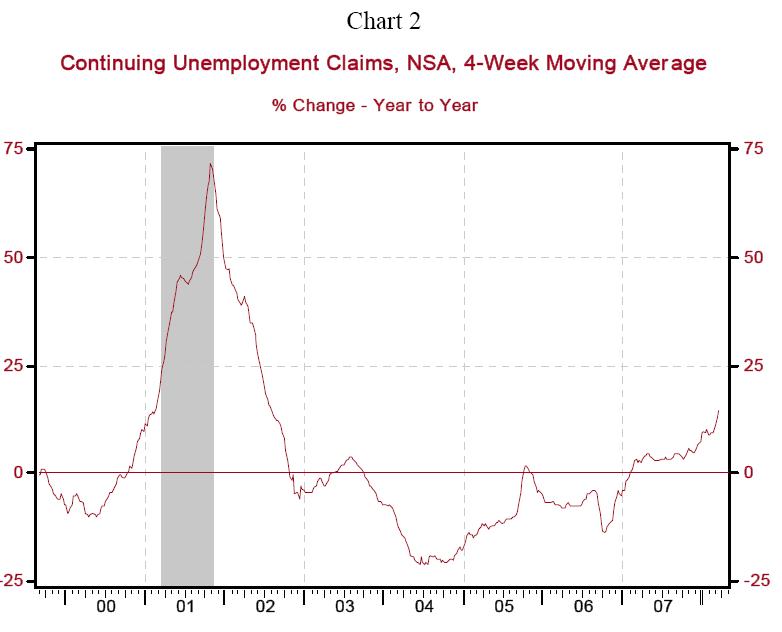
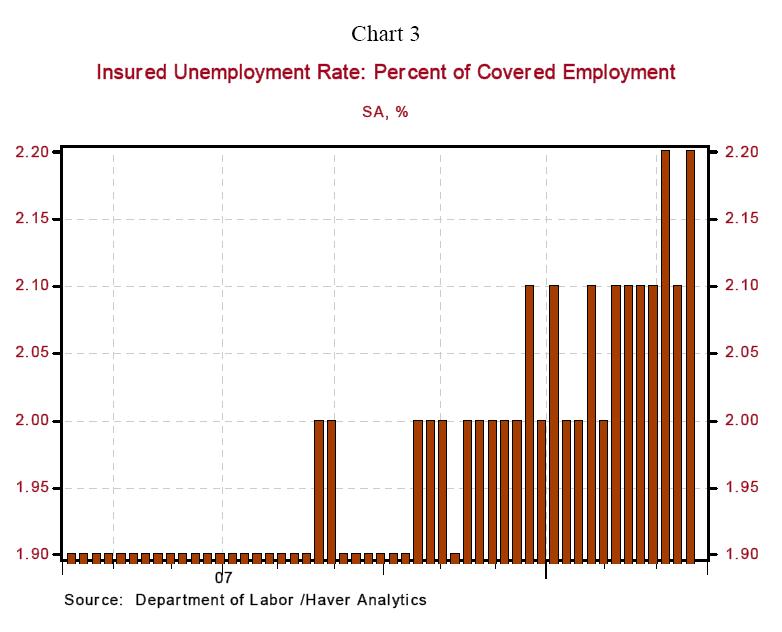
Obviously, the latest observation is affected by the surge in the latest one-week tally. But if we rewind the tape a little, we still see double digit year-over-year percentage increases in the 4 weeks ended March 15 (13.13%) and March 22 (14.35%). A similar rising pattern has been established for continuing unemployment claims (see Chart 2). Chart 3 shows that the unemployment rate among those covered by out-of-work insurance has stair-stepped its way up from 1.9% to 2.2%. In the words of Alfred Kahn, President Carter's Council of Economic Advisers chairman - the economy has entered a "banana."
By Paul L. Kasriel
The Northern Trust Company
Economic Research Department - Daily Global Commentary
Copyright © 2007 Paul Kasriel
Paul joined the economic research unit of The Northern Trust Company in 1986 as Vice President and Economist, being named Senior Vice President and Director of Economic Research in 2000. His economic and interest rate forecasts are used both internally and by clients. The accuracy of the Economic Research Department's forecasts has consistently been highly-ranked in the Blue Chip survey of about 50 forecasters over the years. To that point, Paul received the prestigious 2006 Lawrence R. Klein Award for having the most accurate economic forecast among the Blue Chip survey participants for the years 2002 through 2005.
The opinions expressed herein are those of the author and do not necessarily represent the views of The Northern Trust Company. The Northern Trust Company does not warrant the accuracy or completeness of information contained herein, such information is subject to change and is not intended to influence your investment decisions.
Paul L. Kasriel Archive |
© 2005-2022 http://www.MarketOracle.co.uk - The Market Oracle is a FREE Daily Financial Markets Analysis & Forecasting online publication.