Buy Gold and Silver Stocks With Both Hands and Feet
Commodities / Gold & Silver Stocks Apr 03, 2008 - 11:06 AM GMTBy: Clive_Maund

 The sudden about-face last night to become bullish on gold and silver stocks again requires some explanation. We have been aware for some considerable time that Precious Metals stocks have been woefully underperforming gold and silver, a point made clear by Mr Bob Moriarty of www.321gold.com in his recent article Buy with both hands , but were not minded to go long because our research indicated that another heavy decline in gold and silver was imminent, which is what we have just seen.
Gold dropped by a hefty $33 yesterday, vindicating our near-term bearish stance, but what was remarkable was that while Precious Metals stocks dropped substantially, the drop was nowhere near commensurate with the size of the drop in gold. Regardless of the extent to which this can be attributed to the strong rise in the broad market, it was a bullish sign. It implies two things - one is that even if gold does fall to our original immediate downside target at or below $850, stocks are unlikely to fall much further, the other is that the moment gold and silver turn up stocks are likely to rebound sharply. This was the reason we ditched our speculative Puts yesterday in the last hour of trading for a profit.

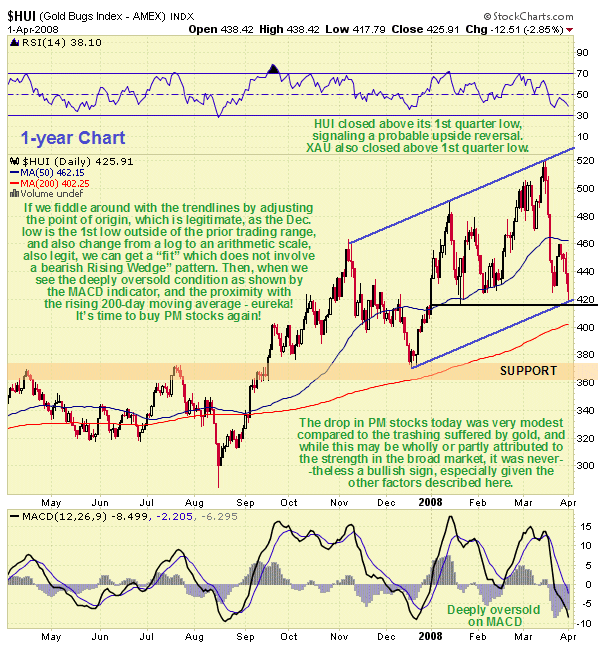
On the 1-year chart for the HUI index which was posted on the site last night as a preliminary to this full article we can see 3 compelling reasons suggesting that stocks have hit bottom and are now a strong buy here. One is that they yesterday refused to break below their low of the 1st quarter, a strongly bullish sign. Another is that they have dropped back to the lower support line of the uptrend channel shown. Still another is that the index is now not far above a rising 200-day moving average, a classic buy spot, with a support zone not far beneath.
Finally the index is now deeply oversold, as shown by the MACD indicator at the bottom of the chart. Now, you may ask, weren't we talking about a bearish convergence of the uptrend channel on this chart a few days back? That's true, we were, and the channel lines do converge when the point of origin of the lower channel line is taken to start from the August low, and when log scaling is used, but when the point of origin is taken from the December low, which is legitimate as it is outside of the earlier trading range, and arithmetic scaling is used, the bearish convergence of the channel lines is eliminated. Is this a fudge? - we would rather call it an adjustment - a necessary one as the other factors we have just listed are indicating that we are very probably at a bottom.
More follows for subscribers...
By Clive Maund
CliveMaund.com
© 2008 Clive Maund - The above represents the opinion and analysis of Mr. Maund, based on data available to him, at the time of writing. Mr. Maunds opinions are his own, and are not a recommendation or an offer to buy or sell securities. No responsibility can be accepted for losses that may result as a consequence of trading on the basis of this analysis.
Mr. Maund is an independent analyst who receives no compensation of any kind from any groups, individuals or corporations mentioned in his reports. As trading and investing in any financial markets may involve serious risk of loss, Mr. Maund recommends that you consult with a qualified investment advisor, one licensed by appropriate regulatory agencies in your legal jurisdiction and do your own due diligence and research when making any kind of a transaction with financial ramifications.
Clive Maund Archive |
© 2005-2022 http://www.MarketOracle.co.uk - The Market Oracle is a FREE Daily Financial Markets Analysis & Forecasting online publication.


