


Utility Stocks - Today’s Best Bond Alternative
Companies / US Utilities Aug 22, 2013 - 06:00 PM GMT

 To refer to any stock or equity as an alternative to bonds or fixed income is sure to stir up the ire and consternation of many professional and individual investors alike who deem themselves prudent. Frankly, under normal circumstances I would tend to agree. But the nature of bonds and other fixed income instruments are not normal today. With today’s extreme, and in the minds of many, contrived low level of interest rates, the risk profile of bonds and fixed income are far from typical. More simply stated, the currently extreme low level of interest offered by bonds and other fixed income instruments have dramatically altered, and I contend, increased their risk profile.
Consequently, the safety gap between equity and debt instruments has, temporarily at least, narrowed. In other words, I do not believe that fixed income offers the large safety advantage over equities that it normally has, or once did. As I will attempt to illustrate, the equity versus bond safety comparison is most relevant to the specific sector 55 Utilities. But again, this may only prove to be a temporary phenomenon, but as we sit today, fixed income is clearly no longer the safe haven it once was. When interest rates eventually rise, and I’m certain that they will, but not certain as to when, bond prices, especially longer-term bond prices, will fall. This potential price volatility could be as dramatic, or even worse, than we seen with our worst bear markets in stocks.
In addition to the safety factor, the second primary reason to invest in bonds was their high yield. Under normal circumstances, bonds often offered interest yields that were multiples of the dividend yields available from the average dividend paying common stock. Therefore, in addition to the safety factor, a balanced portfolio comprised of stocks and bonds was not only prudent, but also generated a higher level of income. This was especially relevant to retired investors in need of income to live off of.
However, in today’s world, high quality blue-chip dividend paying stocks offer a yield advantage over fixed income. First of all, and in many cases, their yields are higher than what is available from even a long-term bond. Second, best-of-breed dividend paying blue chips, purchased at sound valuations, provide the opportunity for capital appreciation and an increasing dividend income stream. Therefore, although loaning your money at interest was once a wise investment decision, today ownership in many ways has the upper hand over loanership.
The Public Utility Holding Company Act of 1935 (PUHCA)
In 1935, under the urging of then-President Franklin Delano Roosevelt (FDR), Congress passed The Public Utility Holding Company Act with the purpose of regulating electric utilities. This limited electric utility companies to only providing electricity within a limited state-by-state geographic area. Therefore, and from that day forward, electric utilities became a regulated, quasi-public/private industry. I contend that the regulation of this industry created a two-edged sword, so to speak. On the one hand, the regulated aspect of their business provides the safety factor over most other sectors that I alluded to earlier. But on the other hand, regulation has placed a brake on their ability to grow. Consequently, regulated public utility companies typically offer below-average earnings growth. However, this is partially compensated for by the above-average current yields they offer.
The Utilities Sector
This is the eleventh and final article in a series of articles designed to find value in today's stock market environment. It is the tenth of 10 articles covering the 10 major general sectors. In my first article, I laid the foundation that represents the two primary underlying ideas supporting the need to publish such a treatise. First and foremost, that it is not a stock market; rather it is a market of stocks. Second, that regardless of the level of the general market, there will always be overvalued, undervalued and fairly valued individual stocks to be found.
My first article was titled "Searching For Value Sector By Sector," my second article was titled "Finding Great Value In The Energy Sector." My third article was titled "Finding Value In The Materials Sector Is A Material Thing." My fourth article was titled "The Industrial Sector Offers A Lot Of Value, Dividend Growth And Income." My fifth article was titled Beware The Valuations On The Best Consumer Discretionary Dividend Growth Stocks, and my sixth article was titled, Are Blue-Chip Consumer Staples Worth Today's Premium Valuations?, my seventh article For A Healthier Portfolio - Look Here, my eighth article Is The Financial Crisis Over For Financial Stocks?, my ninth: Improve The Productivity Of Your Dividend Growth Portfolio With Technology, and The Telecommunications Services Sector Untethered and Poised to Grow.
As a refresher, my focus in this and all subsequent articles will be on identifying fairly valued dividend growth stocks within each of the 10 general sectors that can be utilized to fund and support retirement portfolios. Therefore, when I am finished, the individual investor interested in designing their own retirement portfolio should find an ample number of selections to properly diversify a dividend growth portfolio with.
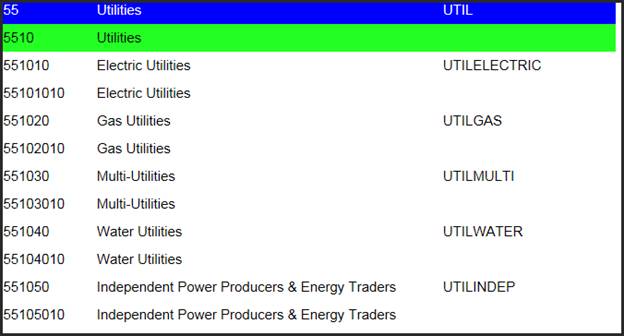
This article will look for undervalued and fairly valued individual companies within the general sector 55-Utilities. Within this general sector, there are several subsectors, which I list as follows:
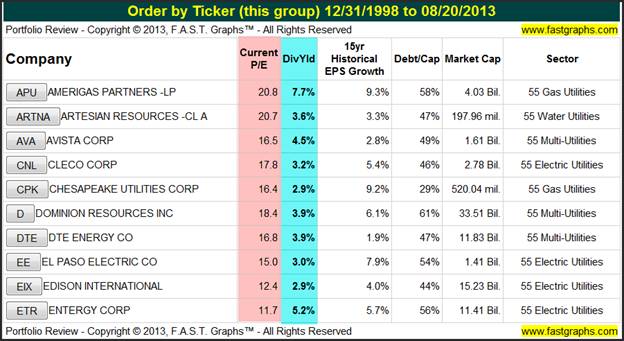
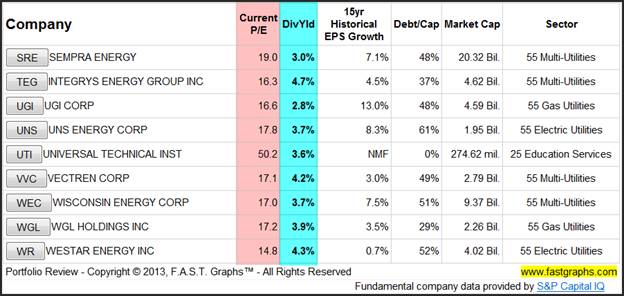
Select Utility Candidates List
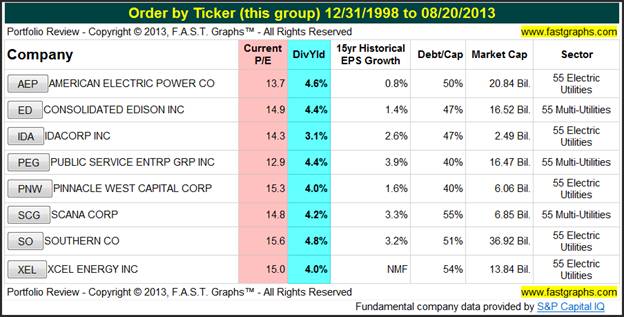
The following portfolio review lists several hand-selected prospective utility stocks in alphabetical order that I felt were currently worthy of consideration. However, and as I will elaborate more on later, due to the typically low earnings growth rate of utility stocks, purchasing them at sound valuation is critical. Simply stated, because these regulated businesses have such low growth rates, they offer little margin for error. I believe you make your money on the buy side, and in order to make any money with utility stocks, they must be purchased at sound valuations.
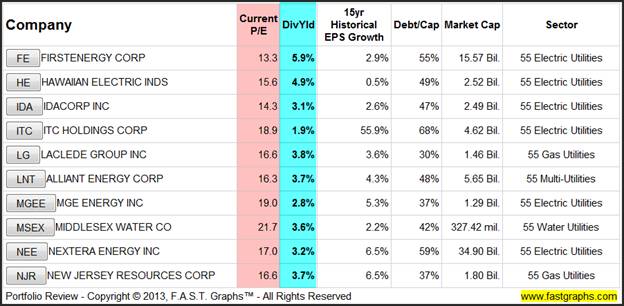
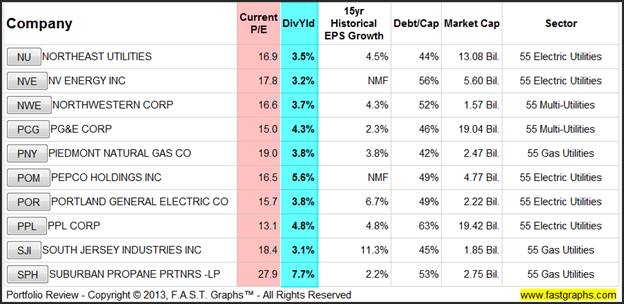
Moreover, as a general guideline, purchasing utility stocks at sound valuation implies never paying a P/E ratio over 15. Not only will this offer a reasonable earnings yield of between 6%-7%, it will typically provide the income investor an attractive and above-average current dividend yield. But as always, there are exceptions to every rule. In the case of the Utility sector, the exceptions will most often be found among specialty utilities such as water or gas.
Consequently, I alert the reader to the fact that several of your typical electric utilities on the following list currently have P/Es higher than 15. Therefore, I suggest that any typical electric utility with a P/E over 15 on the following list could be given consideration, but only purchased if the price falls enough where the current P/E ratio drops to 15 or below. If history is any guide, I believe that by watchful waiting, the opportunity to purchase any of the following utilities will eventually manifest.
The Danger and Potentially Disastrous Results of Overpaying for a Utility Stock
As I previously discussed, there is no margin of safety when overpaying for a utility stock. Although I do believe that this is one of the safest of all sectors to invest in, that safety factor can easily be lost when overvaluation is present. Therefore, and to make this as clear as possible, I offer the following example of the potentially disastrous results that can occur if you overpay for a low growth utility. To illustrate my point, I will utilize the F.A.S.T. Graphs™ Earnings and Price Correlated research tool and showcase PPL Corp (PPL) an Allentown, Pennsylvania headquartered utility.
PPL Corp (PPL)
“PPL Corporation, an energy and utility holding company, engages in the generation, transmission, distribution, and sale of electricity to wholesale and retail customers in the United States and the United Kingdom. The company operates in four segments: Kentucky Regulated, U.K. Regulated, Pennsylvania Regulated, and Supply. It is also involved in the distribution and sale of natural gas in Kentucky. In addition, the company develops renewable energy projects; and provides energy-related products and services to commercial and industrial customers. As of December 31, 2012, it had approximately 19,000 megawatts of generation capacity; and delivered electricity and natural gas to approximately 10.5 million end-users. PPL Corporation was founded in 1920 and is headquartered in Allentown, Pennsylvania.” Description courtesy Capital IQ
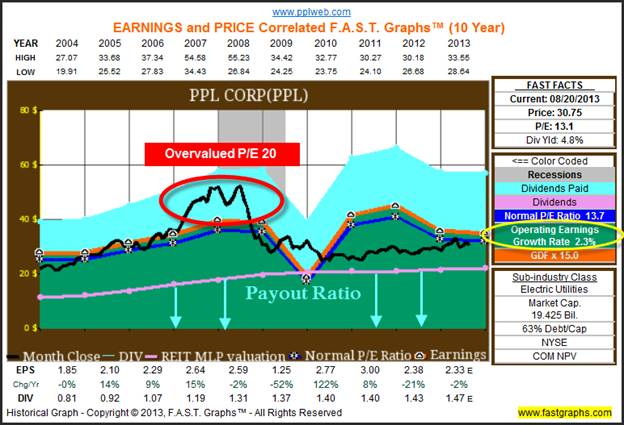
The following Earnings and Price Correlated Graph illustrates that historically PPL Corp’s share price could be purchased at a P/E ratio of 15 or less since 2004 (Note: the orange line on the graph depicts a PE of 15). However, as indicated by the red circle on the graph there was a brief span of a year or so when PPL Corp’s P/E ratio was significantly above the orange line. At its peak, instead of a normal P/E ratio of 15 or less (the orange line), the black monthly closing stock price line uncharacteristically rose significantly above the 15 P/E (2007-2008). Later I will showcase the devastating results that this caused for long-term shareholders that unwittingly purchased this utility when its price was too high.
However, before I move on, a few more comments on the Earnings and Price Correlated Graph are in order. The pink line on the graph plots dividends per share, the green shaded area below the pink line illustrates the payout ratio (the percentage of earnings paid to shareholders). My objective in focusing the reader’s attention to the dividend line is to illustrate both the consistency and the low growth rate of PPL Corp’s dividend record. In other words, their dividend was similarly steady as the interest coupon you might expect from a bond. Also, focus on the low rate of earnings growth achieved over this timeframe.
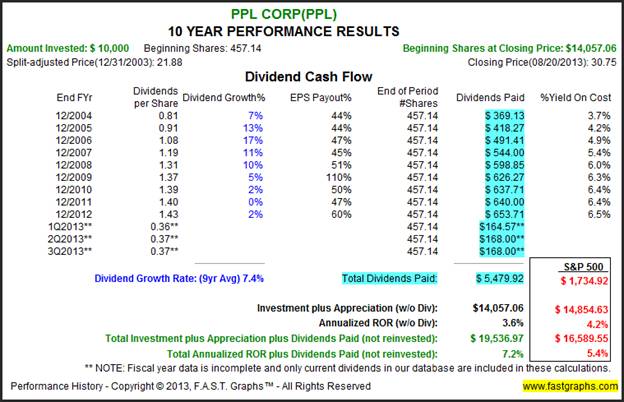
Since the black monthly closing stock price was initially below the orange line indicating a starting P/E ratio of less than 15, the reader should expect that capital appreciation would correlate closely to the operating earnings growth rate. However, the initial low valuation increased capital appreciation to 3.6%, slightly above the operating earnings growth rate of 2.3%.
Moreover, and importantly as it relates to this article on utility stocks, the company’s steady and growing dividend allowed shareholders to exceed the return on the S&P 500 when the dividends are tallied and included. Therefore, purchasing PPL Corp when valuation was sound resulted in attractive, and for the many reasons already stated in the article, relatively safe and acceptable long-term returns.
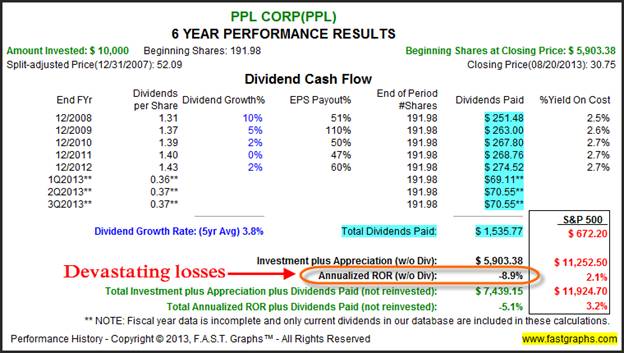
In contrast, let’s look at what would have happened to any shareholders that unwisely or unwittingly purchased PPL Corp when valuation was excessive. At the beginning of 2008, PPL Corp’s P/E ratio had ballooned to approximately 20. As you will soon see, this also was a time when PPL Corp’s current yield was only 2.5%, significantly below a more normal 4% to 5% level when valuation was sound.
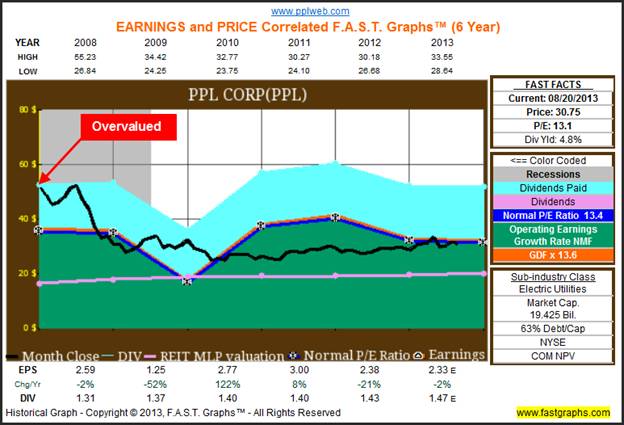
The results of paying too much for this quality utility were devastating. An original $10,000 investment on December 31, 2007 would today only be worth $5903.38. That represents a compounded annual loss of principal of approximately 8.9% per annum. Even when dividends are added, long-term shareholders still suffered unacceptable losses. It would be hard to argue that losing approximately half your principal was a safe investment. Therefore, I cannot emphasize enough the importance of being very careful regarding the valuation you pay before investing in a utility stock.
Blue-chip Utility Selections Fairly Valued
The following portfolio review lists eight high quality utility companies that I feel are fairly valued today and worthy of consideration for investment into a dividend income portfolio. Note that they can all be purchased at a P/E of 15 (or very close to it) or less.
Quintessential Utility Stock Examples: Southern Company and Xcel Energy Inc
Since a picture is worth 1000 words, the following earnings and price correlated graphs and performance tables on my two featured utility examples illustrate what this article has been discussing about the performance and safety characteristics of utility stocks. (Note that in both the examples below the orange earnings justified valuation line represents a P/E ratio of 15 everywhere across the entire graph.)
Southern Company (SO)
“The Southern Company, together with its subsidiaries, operates as a public electric utility company. The company is involved in the generation, transmission, and distribution of electricity through coal, nuclear, oil and gas, and hydro resources in the states of Alabama, Georgia, Florida, and Mississippi. It constructs, acquires, owns, and manages generation assets. As of December 31, 2012, the company owned and/or operated 33 hydroelectric generating stations, 32 fossil fuel generating stations, 3 nuclear generating stations, 13 combined cycle/cogeneration stations, 4 solar facilities, 1 landfill gas facility, and 1 biomass facility. The company also provides digital wireless communications services with various communication options, including push to talk, cellular service, text messaging, wireless Internet access, and wireless data; and wholesale fiber optic solutions to telecommunication providers in the Southeast under the Southern Telecom brand name. The company was founded in 1945 and is headquartered in Atlanta, Georgia.” Description courtesy Capital IQ
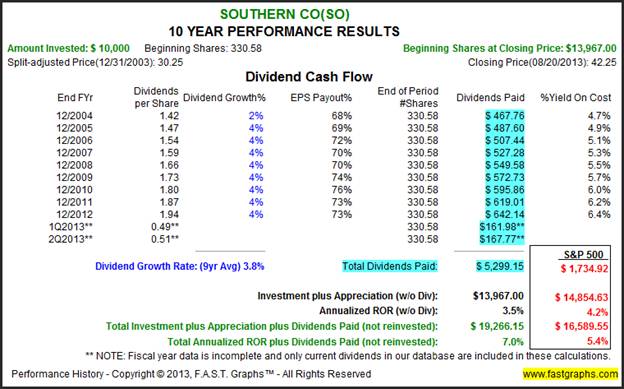
Southern Company represents a quintessential example of a consistent but slow-growing blue-chip utility stock. Moreover, we see that dividends have closely tracked earnings growth except that they have risen even more steadily and consistently. A focus on the company’s earnings (the orange line) and the dividends (the pink line) present what I contend to be very “bond like” characteristics. Furthermore, I believe the earnings and dividend lines also paint a picture of safety. Even the black monthly closing stock price line presents less volatility than you would find with most companies in other sectors.
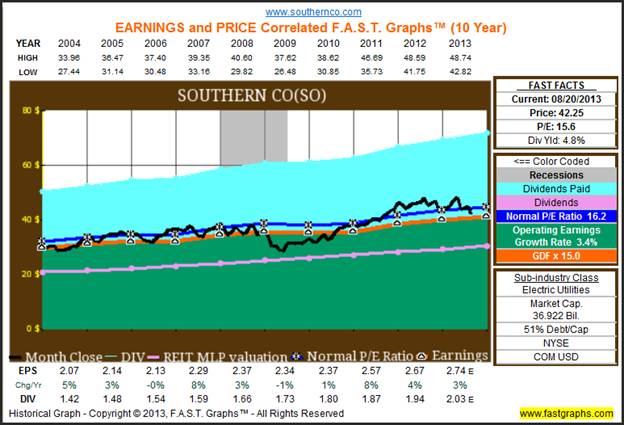
Since Southern Company starts out at fair value (price touches the orange line), and approximately ends there, it is readily apparent that price performance would correlate very closely with earnings. The capital appreciation component of 3.5% per annum, is almost identical to the company’s operating earnings growth rate of 3.4%. Moreover, the above-average dividend yield offered by this utility when it’s at fair value creates S&P 500 beating total returns.
Xcel Energy Inc. (XEL)
“Xcel Energy Inc., through its subsidiaries, engages in the generation, purchase, transmission, distribution, and sale of electricity in the United States. It operates through Regulated Electric Utility, Regulated Natural Gas Utility, and All Other segments. The company generates electricity using coal, nuclear, natural gas, hydro, solar, biomass, oil, and wind energy sources. It is also involved in the purchase, transportation, distribution, and sale of natural gas. In addition, the company engages in developing and leasing natural gas pipelines, and storage and compression facilities; and investing in rental housing projects. It serves residential, commercial, and industrial customers, as well as public authorities in the portions of Colorado, Michigan, Minnesota, New Mexico, North Dakota, South Dakota, Texas, and Wisconsin. Xcel Energy Inc. was founded in 1909 and is based in Minneapolis, Minnesota.” Description courtesy of Capital IQ
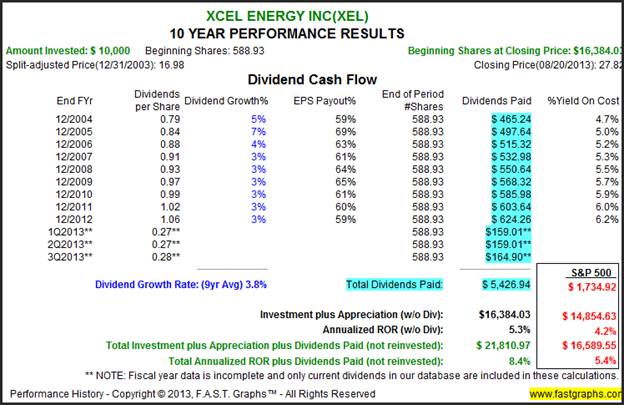
Xcel Energy Inc represents a second quintessential example of a consistent but slow-growing blue-chip utility stock. Moreover, we again see that dividends have closely tracked earnings growth except that they, like we saw with Southern Company, have risen even more steadily and consistently. A focus on the company’s earnings (the orange line) and the dividends (the pink line) once again present what I contend to be very “bond like” characteristics. Furthermore, I believe the earnings and dividend lines also paint a picture of safety. Once again, even the black monthly closing stock price line presents less volatility than you would find with most companies in other sectors.
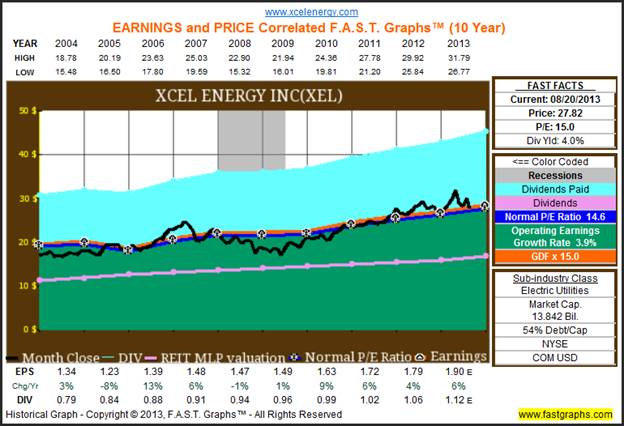
Since Xcel Energy starts out slightly below fair value (price below the orange line), and ends at approximately fair value, it is readily apparent that price performance would slightly exceed operating earnings growth. The capital appreciation component of 5.3% per annum is modestly greater than the company’s operating earnings growth rate of 3.9%. Moreover, the above-average dividend yield offered by this utility when it’s at fair value also creates S&P 500 beating total returns.
But most importantly, with this example we see the benefit that can be gained by investing in a quality utility when your entry price represents undervaluation. Not only does this mitigate risk even beyond the safety that utility stocks naturally offer, it simultaneously expands all returns, total dividends and capital appreciation.
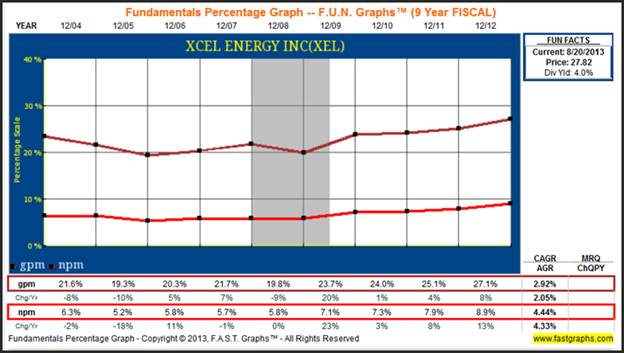
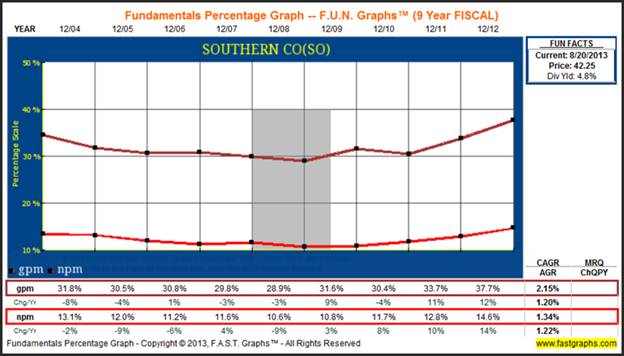
Net and Gross Profit Margin: Xcel Energy Inc and Southern Co
By their very nature, utility stocks tend to be capital-intensive businesses that often carry high debt loads as a result. However, the gross and net profit margins of many utility stocks are surprisingly strong. Apparently, even though these companies are regulated, which limits growth, their margins are reasonably high. The following FUN Graphs depict the gross and net profit margins for Xcel Energy Inc and Southern Co.
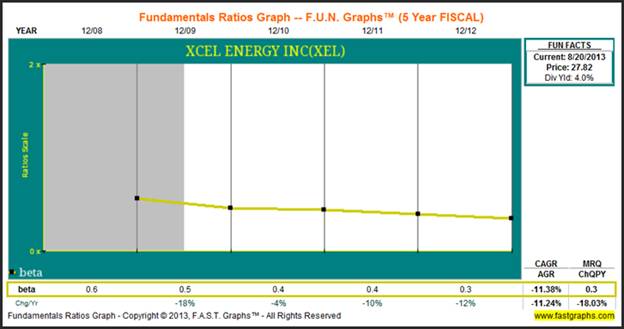
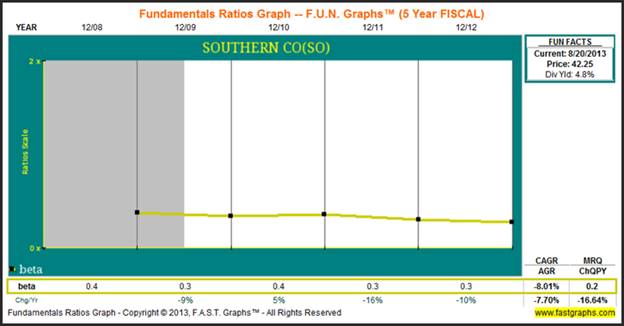
Beta : Low Volatility Low Risk
To be perfectly candid, as a fundamental investor I tend to eschew any metric that deals solely with price or price movement. Nevertheless, since this article has dealt extensively with discussions about risk, and since many consider beta a measurement of risk, I swallow my pride and include the rolling 5-year betas on my featured companies - Xcel and Southern Co.
For those who do consider price volatility as a form of risk, then the low betas on both of my sample companies would indicate low risk. Certainly this provides clear evidence that price volatility with low growth blue-chip utility stocks is very low. Consequently, investing in utility stocks might spare investor angst in today’s highly volatile stock markets.
Summary and Conclusions
In today’s low interest rate environment investors are hungry, and some even desperate to find investments that provide both yield and safety. Admittedly, and during normal times, I might stop short of calling any equity in any sector bond alternatives. However, these are not normal times. Therefore, as long as rates currently remain at excessively low levels, then I believe that select utility stocks trading at fair or low valuations could be given consideration in lieu of traditional fixed income investments.
As I indicated throughout this article, safety, yield and total return are all dependant on sound valuation when investing in utilities. Due to their regulated nature, I do believe that utility stocks provide more predictability than most equity classes. However, predictability comes at a price, and that price is low growth coupled with low capital appreciation potential and a slow rate of dividend growth. On the other hand, the above-average yields that utilities often offer make them attractive candidates for yield-hungry investors seeking safety of principal along with decent yields. But once again, in order to receive the benefits of safety and yield that utilities offer, investors must be very careful with their entry prices.
This concludes my series of articles searching for attractively valued dividend growth stocks in today’s low interest rate environment.
Disclosure: No positions at the time of writing.
By Chuck Carnevale
Charles (Chuck) C. Carnevale is the creator of F.A.S.T. Graphs™. Chuck is also co-founder of an investment management firm. He has been working in the securities industry since 1970: he has been a partner with a private NYSE member firm, the President of a NASD firm, Vice President and Regional Marketing Director for a major AMEX listed company, and an Associate Vice President and Investment Consulting Services Coordinator for a major NYSE member firm. Prior to forming his own investment firm, he was a partner in a 30-year-old established registered investment advisory in Tampa, Florida. Chuck holds a Bachelor of Science in Economics and Finance from the University of Tampa. Chuck is a sought-after public speaker who is very passionate about spreading the critical message of prudence in money management. Chuck is a Veteran of the Vietnam War and was awarded both the Bronze Star and the Vietnam Honor Medal.
© 2013 Copyright Charles (Chuck) C. Carnevale - All Rights Reserved Disclaimer: The above is a matter of opinion provided for general information purposes only and is not intended as investment advice. Information and analysis above are derived from sources and utilising methods believed to be reliable, but we cannot accept responsibility for any losses you may incur as a result of this analysis. Individuals should consult with their personal financial advisors.
Chuck Carnevale Archive |
© 2005-2022 http://www.MarketOracle.co.uk - The Market Oracle is a FREE Daily Financial Markets Analysis & Forecasting online publication.