Case of the Missing Corn
Commodities / Agricultural Commodities Aug 19, 2013 - 02:24 PM GMTBy: Ned_W_Schmidt
 200 million bushels of corn suddenly disappear. Could the mystery of the disappearing corn be rich material for Erle Stanley Gardner? Probably not. Most of that disappearing corn was fantasy corn, existing only in the imagination of some forecasters. That missing corn was revealed in USDA's latest World Agricultural Supply & Demand Estimates(WASDE). Further, analysis of USDA's acreage certification report by Bryce Knorr of FarmFutures.com suggests that USDA estimates for U.S. corn acreage may be too high by as much as 2.7 million acres. Should Knorr be correct, another 300 million bushels of corn may disappear.
Much has been written about the size of the U.S. corn crop to be harvested this coming Fall. Per the latest WASDE, the world will have 58.9 days of corn consumption in reserve at the end of August 2014. That estimate presumes that the demand forecasts are accurate. Demand higher than forecast, which is quite likely, would make the situation worse. When global demand growth is considered, December corn has likely already made a long-term low, one not to be revisited.
Not part of the typical demand calculation is that represented by small speculators. Per the COT from the U.S. CFTC, small speculators were net short more than 80 thousand contracts for future delivery of corn. As contracts mature, those short corn must eventually repurchase contracts representing more than 400 million bushels. That additional "demand" should support prices.
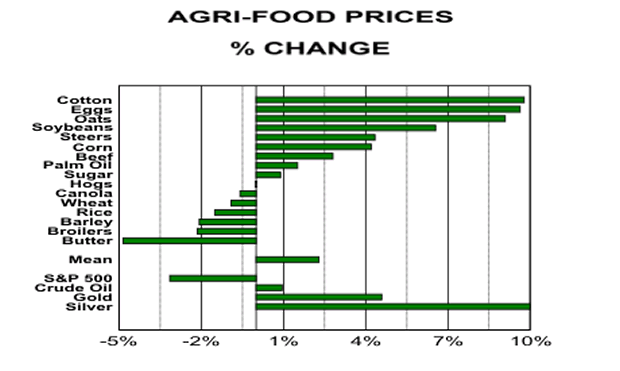
August is when reality begins for Agri-Grain forecasts. Up till then it is all paper grains. In August the real counting begins. Latest WASDE seems to have reset the mood in Agri-Commodity markets. While admittedly too short a time, since the beginning of August a new tone has settled into Agri-Commodity markets as shown in following graph of percentage price changes thus far in August.

First thing to note in that chart is the world of Agri-Food is far more than corn. Agri-Commodity prices have been strong thus far in August. Material weakness is evident only in butter and the stock market, both of which are known for being somewhat "greasy". Finally, commodities in general have developed strength this month. We note that not a month ago Agri-Commodities and precious metals, Gold and Silver, were "written off" by many investment "gurus".

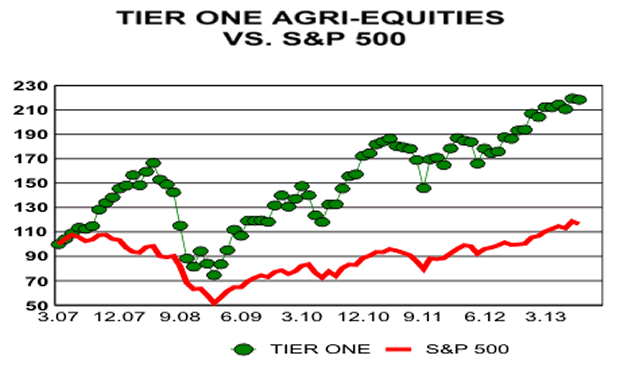
In the above chart is plotted our index of Tier One Agri-Equities. As can be readily observed, ignoring Agri-Equities, as many gurus would have had you do, has had a serious cost. Agri-Equities are in their seventh year of performance. The years ahead? People of the world will eat everyday. Consumers in developing nations are going to further upgrade their diets. Quite simply, incomes in China and the developing world are rising faster than the world's ability to produce Agri-Food. That situation suggests higher prices and volumes over time, and that means higher revenues for Agri-Industries.
By Ned W Schmidt CFA, CEBS
AGRI-FOOD THOUGHTS is from Ned W. Schmidt,CFA,CEBS, publisher of The Agri-Food Value View, a monthly exploration of the Agri-Food grand cycle being created by China, India, and Eco-energy. To contract Ned or to learn more, use this link: www.agrifoodvalueview.com.
Copyright © 2013 Ned W. Schmidt - All Rights Reserved
Ned W Schmidt Archive |
© 2005-2022 http://www.MarketOracle.co.uk - The Market Oracle is a FREE Daily Financial Markets Analysis & Forecasting online publication.


