


Stock Market Correction Likely Underway
Stock-Markets / Stock Markets 2013 Aug 19, 2013 - 02:04 PM GMTBy: Tony_Caldaro

 The market gapped down at the open on Monday to SPX 1681, rallied back to 1697 by Tuesday, then headed south for the rest of the week hitting 1653 on Friday. It does appear Major wave 4 has been underway since SPX 1710 as expected. For the week the SPX/DOW were -2.15%, the NDX/NAZ were -1.50%, and the DJ World index lost 1.0%. On the economic front reports were mixed: six rising, six declining and four unchanged. On the uptick: retail sales, the CPI, NAHB housing, housing starts, building permits and the weekly jobless claims improved. On the downtick: consumer sentiment, the WLEI, import prices, the NY/Philly FED, and the budget deficit increased. Industrial production, the PPI, business inventories and export prices were all unchanged. Are things beginning to slow down? Next week we get the FOMC minutes, and reports on housing and the leading indicators.
LONG TERM: bull market
The 2009-2014 bull market continues to unfold as anticipated. While some EW’ers continue to doubt this is a bonafide bull market. It continues to impulse higher, and recently reached 8.5% above its previous all time high. We continue to track this bull market as Cycle wave [1]: the first phase of a Super cycle 3 multi-decade bull market.
Bull market Cycle waves unfold in five Primary waves. Primary waves I and II concluded in 2011, and Primary wave III has been underway since then. Primary I divided into five Major waves, with Major wave 1 subdividing into five Intermediate wave/trends. Primary wave III is following a similar path. It is also dividing into five Major wave/trends, but both Major waves 1 and 3 have been subdividing.
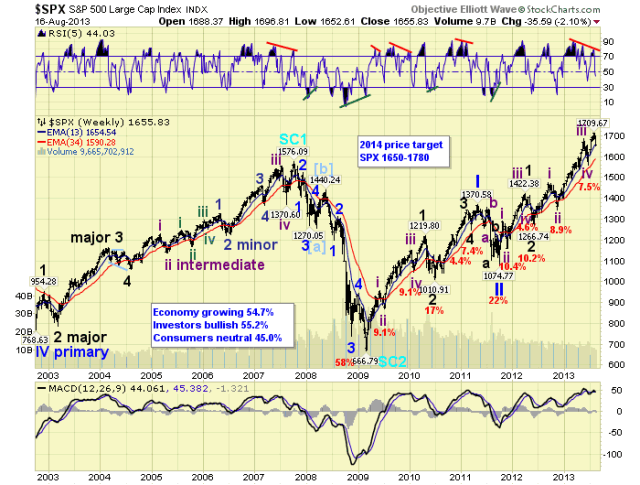
Major waves 1 and 2 completed by mid-2012, and Major wave 3 has been underway since then. Intermediate waves i and ii, of Major 3, completed by late-2012. Intermediate waves iii and iv completed by mid-2013, and Intermediate wave v may have just completed this month. Should this be correct, Major wave 3 has concluded and a Major wave 4 correction is underway. After a 10% or so decline Major wave 4 should end. Then a Major wave 5 uptrend will complete Primary wave III. After a Primary wave IV correction follows, Primary wave V should end the bull market. We continue to target the final high around SPX 1780 by late-winter to early-spring of 2014.
MEDIUM TERM: downtrend probably underway
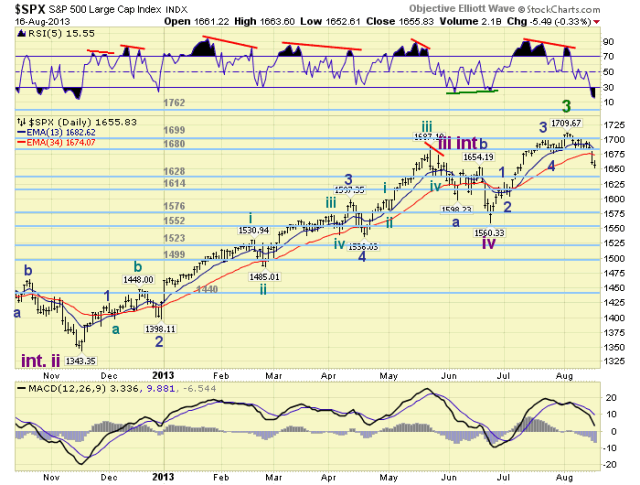
We counted the Intermediate wave v uptrend as five Minor waves SPX: 1627-1605-1699-1676-1710. The last advance, Minor wave 5, was quite choppy in the SPX, but appeared as an ending diagonal in the DOW. The DOW, btw, was the first to display weakness after its uptrend high. When the recent decline began, accompanied with negative divergences on nearly every time frame, it was a bit slow developing in the SPX. As of Wednesday, the SPX had only pulled back 27 points after eight days of correctional activity. But the DOW had continued to make lower lows. The fourteen point gap down opening on Thursday got the correction underway.
When this downtrend is confirmed the market will have completed Major wave 3 of Primary III. Major wave 3 began in June 2012 at SPX 1267. During this 14 month wave the market has risen 35%, or 443 SPX points. Normal Fibonacci retracements levels for Major wave 3 suggest: 0.236% = SPX 1605, 0.382% = SPX 1541, and 0.50% = SPX 1489. Since Major wave 2 corrected 45%, after a typically weaker failed Minor wave 5. We are opting for a 0.382% retracement or around SPX 1541 for Major wave 4. This also represents about a 10% correction, which is the mean of the three previous major wave corrections: 17%, 10.2% and 7.4%.
Just above and below this level we have previous 4th waves of a lesser degree: Int. iv SPX 1560 and Minor 4 of Int. iii SPX 1538. Also this level is between two long term pivots: 1523 and 1552. So there is a cluster of support around this area. Since the three previous Major wave corrections have taken either one or three months. We are opting for a one month: August to September time period for Major wave 4. In summary, a 10% correction from SPX 1710 ending in September. Medium term support is at the 1628 and 1614 pivots, with resistance at the 1680 and 1699 pivots.
SHORT TERM
As noted above this correction was quite slow to get going. The first decline was to SPX 1685 which we labeled with a tentative wave a. Then the market gyrated between SPX 1683 and 1700 for several days, before it broke lower. We labeled this period as an expanding triangle wave b. The next decline was quite swift again reaching SPX 1653 on Friday. Thus far we have a small abc down from SPX 1710: 1685-1700-1653. For now we would like to label this decline as Minor a of Intermediate A. Major wave four should decline as three Intermediate waves. For example, we could see Int. a SPX 1630, Int. b SPX 1670, then Int. c SPX 1540.
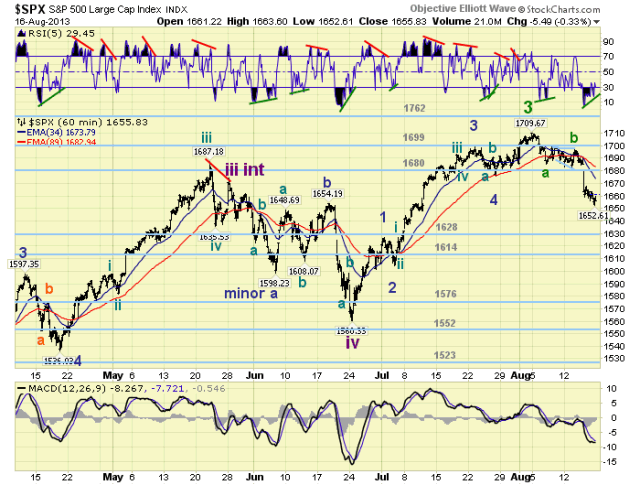
Current support is at SPX 1648-1649, SPX 1636-1640 and the 1628 pivot, with resistance at SPX 1658-1667 and the 1680 pivot. Short term momentum continues to display a positive divergence. The short term OEW charts remain negative with the reversal level SPX 1679. Best to your trading!
FOREIGN MARKETS
The Asian markets were quite mixed gaining 0.4%. India, Indonesia and Japan are in confirmed downtrends.
The European markets were mixed as well gaining 0.6%. No downtrend confirms yet.
The Commodity equity group were all higher gaining 1.8%. No downtrend confirms either.
The DJ World index is still uptrending but lost 1.0%.
COMMODITIES
Bonds continue to downtrend losing 1.4% on the week. 10YR yields have now risen from 1.39% to 2.86% in one year.
Crude continues to uptrend and gained 1.5% on the week.
Gold rallied 4.4% this week as its uptrend continues. Next resistance around the $1420′s.
The USD continues to downtrend, but gained 0.2% on the week.
NEXT WEEK
Wednesday: Existing home sales and the FOMC minutes. Thursday: weekly Jobless claims, FHFA housing prices and Leading indicators. Friday: New home sales. The FED continues to remain in the background. Best to your weekend and week!
CHARTS: http://stockcharts.com/public/1269446/tenpp
http://caldaroew.spaces.live.com
After about 40 years of investing in the markets one learns that the markets are constantly changing, not only in price, but in what drives the markets. In the 1960s, the Nifty Fifty were the leaders of the stock market. In the 1970s, stock selection using Technical Analysis was important, as the market stayed with a trading range for the entire decade. In the 1980s, the market finally broke out of it doldrums, as the DOW broke through 1100 in 1982, and launched the greatest bull market on record.
Sharing is an important aspect of a life. Over 100 people have joined our group, from all walks of life, covering twenty three countries across the globe. It's been the most fun I have ever had in the market. Sharing uncommon knowledge, with investors. In hope of aiding them in finding their financial independence.
Copyright © 2013 Tony Caldaro - All Rights Reserved Disclaimer: The above is a matter of opinion provided for general information purposes only and is not intended as investment advice. Information and analysis above are derived from sources and utilising methods believed to be reliable, but we cannot accept responsibility for any losses you may incur as a result of this analysis. Individuals should consult with their personal financial advisors.
Tony Caldaro Archive |
© 2005-2022 http://www.MarketOracle.co.uk - The Market Oracle is a FREE Daily Financial Markets Analysis & Forecasting online publication.