Gold And Silver Fundamentals Never Say When, Charts Do, It Pays To Listen
Commodities / Gold and Silver 2013 Aug 17, 2013 - 03:57 PM GMTBy: Michael_Noonan
 Finally, a classic example on the importance of reading developing market information, as shown in a chart!
For the past several months, everyone interested in Precious Metals, PMs, has been deluged with never-ending fundamental information about the unprecedented demand for physical gold and silver. Much of the information was compelling, yet, if anyone tried to buy into [paper] futures, it was a financial disaster, despite such strong demand for the underlying physical. It was the lying manipulators of the COMEX and LMBA exchanges that made the differences.
Our constant advice was to buy, accumulate, and personally hold physical gold and silver at any price, all throughout the decline from 2011 highs. The fundamentals dictated that strategy for so many reasons, well beyond the demand situation, but just not in the futures market.
Fundamentals give the reasons for taking a particular action, but they do not provide the critical element of timing. That has changed, at least temporarily, and reading developing market activity, our constant theme, has finally entered the limelight. We use price, volume, and time as the components for reading and timing the markets.
Just as a reminder, technical aspects like moving averages, RSI, MACD, Bollinger Bands, etc, are not a consideration in reading market activity. They are artificial measures using past tense data imposed upon present tense price as a means to "predict" the future tense. We do not have any use for them. The market, itself, provides the best factual information available in order to read its intent.
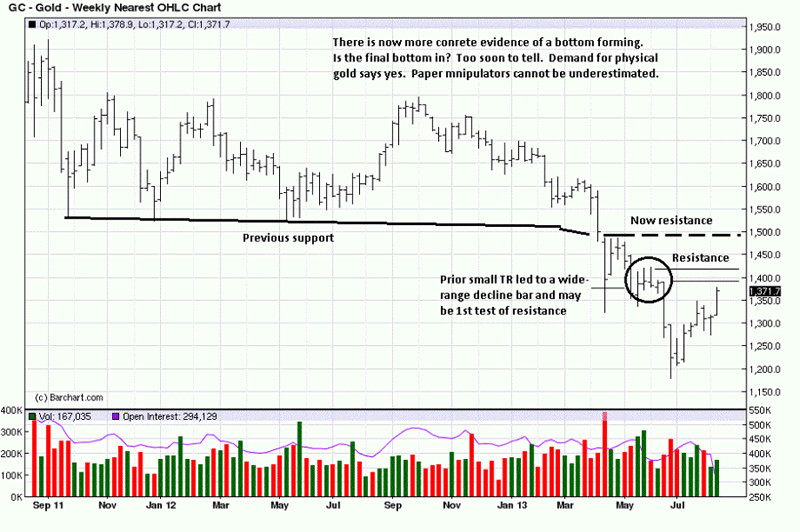
The most important piece of market information always starts with the trend. Gold is now beginning to show signs of a potential bottom. It is too soon to know for certain, at least on the monthly, [not shown], and weekly charts. Absent a surprise "V-Bottom," when price rallies like a sling-shot from the lows, it takes time for a bottom to develop, so one is not being declared, as such. Instead, the weekly chart is used for context, while the daily and intra day charts are more for timing.
The 1500 area is important resistance, as noted. The circled small Trading Range, TR, led to a wide-range decline bar, and the high of that bar, along with the highs of the bars in the TR, forms a near-term potential resistance which is close to being tested. How price reacts to that area will provide important market information. For example, if ranges narrow on a decline in volume, that information alerts us to likely resistance. If the ranges are wide and volume strong, the resistance should give way. Now, a daily chart with greater detail.
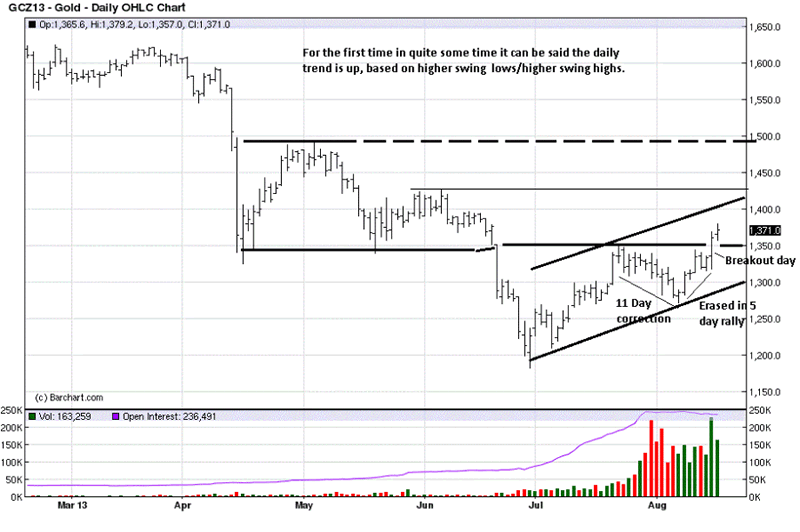
This is the first time since price entered the 18 month TR, after the 2011 highs, that we can say the daily trend is up. It may be short-lived, it may continue higher, we do not know how the next several days/weeks will develop, but we can say for certain, at least for now, there are reasons to trade from the long side.
After the mid-July absorption, discussed in other articles, there was a strong breakout that stalled at obvious resistance. The market gave some important information in how price reacted. It was a labored decline in a market where prior declines were faster. The 11th day bottom was small with a close on the high and above the previous day close. That was the market telling us buyers had stopped sellers during what has been a very negative price environment.
Note how price rallied with ease over the next 3 TDs, then a two-day "correction," and it led to last Thursday's breakout rally, slicing right through the resistance area. We use a 90 minute chart to show how the market left numerous clues for taking action.
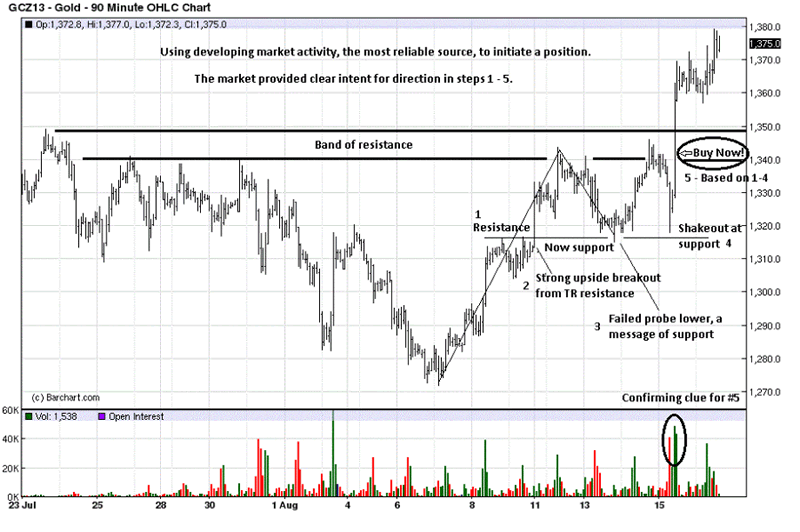
The steps are outlined, 1 - 5. 1 was a small TR that came from a very strong rally bar on equally strong volume. The fact that price consolidated, as opposed to correcting much lower, spoke to underlying strength coming off the lows.
At 2, there is another strong, wide-range rally bar. Volume does not show because it was during overnight hours, but the rally continued right up to resistance. Price backed away and retraced to the highs at 1, and formed a failed probe, at 3. [We took a small loss there, stopped out on that failed probe, unfortunately, which happens.]
Price rallied back to resistance. It is not good practice to buy just below resistance, where price stopped there again, on the 14th. What happened at 4 developed very quickly, and one had to be prepared to recognize events as they were occurring and react to them just as quickly.
The spike down to the low at 4 was followed by an immediate rally back up on increased volume. That alerted us to a potential shakeout, where price drops to "shakeout" weak longs and stops, just before resuming higher. That this development was happening so near a resistance area was a message that gold was ready to move higher, according to information provided by the market itself. It was time to buy and buy now, if the read were accurate. The volume that day was important confirmation that demand had just overwhelmed supply. From lock-and-load at 1 - 4, it was time to "fire" at 5.
The knowledge of market manipulation and huge demand for physical gold provided background that this market was due for a rally, but almost all thought the rally should have happened weeks or months ago. Finally, the charts, in reading the market activity, gave the when to act, with a low-risk entry. The timing for that window of opportunity was about 10 minutes.
This is why we love charts and tout them as the best and most reliable source for market information and the most important element, timing. The timing factor began a few weeks ago when the prospects of absorption were covered. We stated back on 27 July:
"We choose now for buying and holding physical gold and silver. We are on the long side in gold futures, but that can change on any given day."
See Newton's Third Law Is About Ready To [Over]React. Be Prepared. The last sentence of the article, click on http://bit.ly/1bXsEJE .
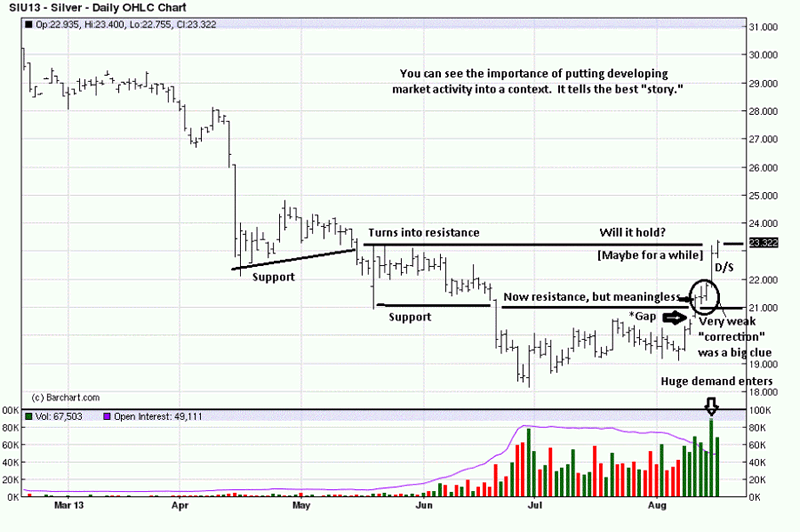
That last bar on the weekly chart speaks volumes, a gap higher from apparent weakness. The odds of silver retesting 26 have increased dramatically.
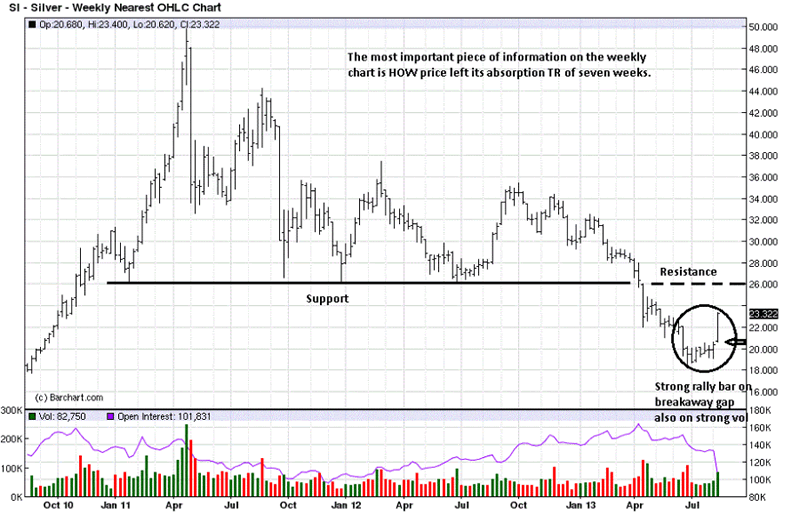
We often mention putting developing market activity into a context as it is the vital step in preparation for when a market moves. The support-turned-into-resistance line is drawn as the market activity dictates, which most often in not simply a straight line, used for convenience and not necessarily accuracy.
The lower support/resistance line meant very little as price sailed right through 21. It shows the importance of how price reacts to an anticipated resistance. Obviously, when it goes right through, the market is telling us to expect higher levels. Silver is already testing the higher resistance line, just above 23.
The "D/S" designates Demand overcoming Supply, evidenced by the wide range up bar and on sharply higher volume. It could not be any clearer that demand, [buyers], took charge. 23+ may act as resistance, but that volume and rally getting there suggests it could be short-lived.
You can see the day of the gap that was shown on the weekly chart. That was one of the market's stronger messages, emphasized even more by the next two days, a consolidation in the form of a rally and not just sideways, as normally occurs.
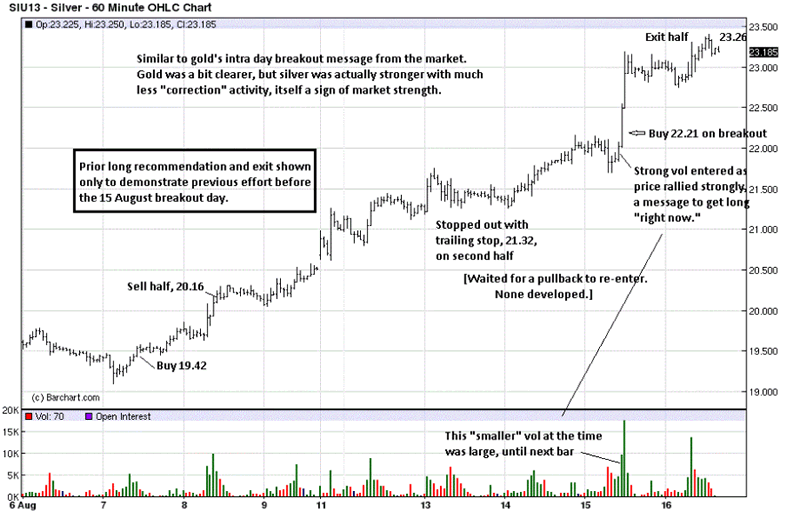
The first time we recommended the long side in silver is indicated, based on a short-term read of developing market activity, back then. It is included as background to inform that the buy signal from last Thursday was not the first, but it was a much better one.
Timing for buying silver that day, just as with gold, was very short, and one had to respond on instinct and not sit back to assess the developing information. That "instinct" actually comes from the necessary preparation work and not simply "shooting from the hip." As the steps were shown in gold, they existed for silver, but silver had been stronger from the "signs" indicated.
As a rule, a trading unit is a minimum of two contracts to enable "half-position" action. Silver reached a potential resistance area on Friday, and taking partial profits on a half- position was warranted. If price moves higher, the other half still gains. If price corrects lower, the "locked-in" half-position takes advantage of a higher prior to a potential correction. This is a form of money management, on our part.
It is not always this clear, but when the market "talks," we listen, for a reason.
By Michael Noonan
Michael Noonan, mn@edgetraderplus.com, is a Chicago-based trader with over 30 years in the business. His sole approach to analysis is derived from developing market pattern behavior, found in the form of Price, Volume, and Time, and it is generated from the best source possible, the market itself.
© 2013 Copyright Michael Noonan - All Rights Reserved Disclaimer: The above is a matter of opinion provided for general information purposes only and is not intended as investment advice. Information and analysis above are derived from sources and utilising methods believed to be reliable, but we cannot accept responsibility for any losses you may incur as a result of this analysis. Individuals should consult with their personal financial advisors.
Michael Noonan Archive |
© 2005-2022 http://www.MarketOracle.co.uk - The Market Oracle is a FREE Daily Financial Markets Analysis & Forecasting online publication.


