A New Floor in the Gold Price?
Commodities / Gold & Silver Apr 03, 2008 - 06:49 AM GMTBy: Adrian_Ash
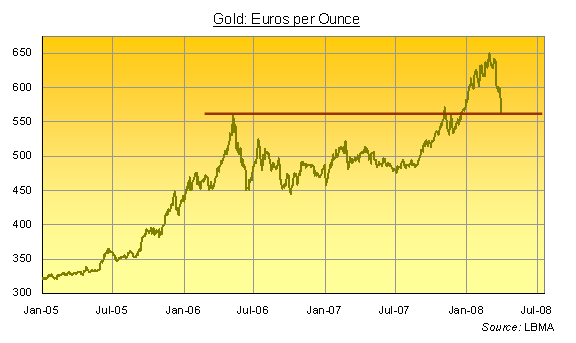
"...And here's where the thick red-wax crayon joins the slump of Spring 2008 to the big spike of May 2007..."
AFTER NOTING an historic move higher in the Gold Price last month, maybe we should be wary of picking a bottom today.
Cracking above 40,000 Deutsche Marks Per Kilo , the price of gold – when converted back from the Euros that German investors now clutch – promptly sank almost 14% from that 27-year top.
In the ensuing sell-off (to date) it bottomed (so far) at the equivalent of €561 per ounce on Tuesday. (You'll note the caveats. The last real sell-off took the Euro gold price right down to a 20% loss.)
But our deep mistrust of technical analysis has failed to beat our fat crayons again. Because the Gold Market low (so far) coincides precisely with another key level in the metal's long-term ascent:
The big "cathedral top" of May 2006...

The mainstream British and European press ignores pretty much all investment news by screwing its eyes tight and hoping the public won't mind. Which we don't, as a rule.
It takes some kind of mania to shake the mass of so-called "savers" to demand prices on tap (tech stocks at the end of '90s; real estate until summer last year). Only a genuine scandal leads the press to wheel out a half-decent analysis (Enron, Northern Rock, Bear Stearns).
So it was disquieting to find gold splashed across the London media last month. Just as in May 2006 – the last blow-off top – the shiny yellow stuff even made an appearance in the tabloids, on radio and on breakfast TV. And the last time gold made headlines on the BBC news, any British, French, German or Italian investors choosing to Buy Gold lost one fifth of their money inside a month.
From 12 May 2006 to mid-June, the price vs. the Euro sank from €561 down to €450 per ounce. It took fully 18 months to recover that level, breaking it decisively at the very end of 2007.
And your crayon doesn't need blunting to match that top with this week's low (to date). So for now at least, that level – of €561 per ounce – marks the bottom of the latest plunge to clear weak hands out of the Gold Market .
Standing almost 14% below the new 27-year high hit on March 3rd this year, that former line of what professional chartists call "resistance" might just prove to be what they'd say is "support".
If not, it will become "failed support" – the failure being the market's fault, of course, rather than any error by the analyst or his thick wax crayon.
By Adrian Ash
BullionVault.com
Gold price chart, no delay | Free Report: 5 Myths of the Gold Market
City correspondent for The Daily Reckoning in London and a regular contributor to MoneyWeek magazine, Adrian Ash is the editor of Gold News and head of research at www.BullionVault.com , giving you direct access to investment gold, vaulted in Zurich , on $3 spreads and 0.8% dealing fees.
(c) BullionVault 2008
Please Note: This article is to inform your thinking, not lead it. Only you can decide the best place for your money, and any decision you make will put your money at risk. Information or data included here may have already been overtaken by events – and must be verified elsewhere – should you choose to act on it.
Adrian Ash Archive |
© 2005-2022 http://www.MarketOracle.co.uk - The Market Oracle is a FREE Daily Financial Markets Analysis & Forecasting online publication.


