


Will S&P 1,650 Offer Stock Market Buying Support?
Stock-Markets / Stock Markets 2013 Aug 16, 2013 - 03:47 PM GMTBy: J_W_Jones

 In my most recent article, I discussed how I was expecting U.S. financial markets to reverse to the downside in the near future. I illustrated the various divergences in a variety of underlying technical indicators which have issued warnings in the past.
Unlike many financial journalists or newsletter operators, I am an option trader first and a writer second. My primary focus is typically to sell option spreads that focus on the passage of time for profitability and/or take advantage of large implied volatility spikes which help to improve my probability of success on each trade taken. Unfortunately in 2013 Mr. Market has not accommodated my style of trading as we have had very low volatility most of the year.
Low volatility levels many times force option traders to take more directional trades which ultimately leads to lower probabilities of success. I still take advantage of stocks that have had implied volatility spikes, but ultimately this market has forced theta sellers to get more aggressive, take more risk, and accept less potential profitability.
I have recently closed several winning positions with members of OptionsTradingSignals.com during the August expiration. Several positions were actually closed Thursday August 15th for gains.
However, what might surprise readers is that several positions that I closed for gains this week and even today were long biased positions. In fact, one of my largest winning trades for the August monthly option expiration cycle was the EWZ Call Debit Spread that was essentially long Brazilian equities. The recent trade results are shown below.
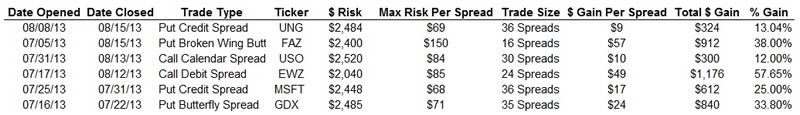
Obviously the recent returns have been strong. However, in full disclosure I have rolled a few positions into September that were showing losses. It is important to note that the forward roll was done for a credit which reduces my position risk and allows for additional profitability in the September monthly expiration if price action accommodates my position.
Unfortunately market conditions this year have not allowed me to take as many trades as I would like for the service. However, the recent track record has been strong and I remain committed that getting long at these prices is dangerous from a risk perspective.
We have a variety of potential headwinds facing U.S. equities such as future Federal Reserve actions that might lead to a reduction in the QE program. Another rather obvious future risk is the seemingly continuous fighting in the United States Congress over the debt ceiling. Historically speaking, when federal politicians are unable to work together regarding the debt ceiling financial markets have not reacted positively.
As can be seen above, today I have closed several open positions for gains and I continue to maintain a variety of long and short positions in my overall portfolio. It goes without saying that I am somewhat Delta negative or leaning short, but I am not expecting an all-out crash. In fact, I expect buyers to show up around the 1,650 price level on the S&P 500 Index (SPX) which is illustrated below.
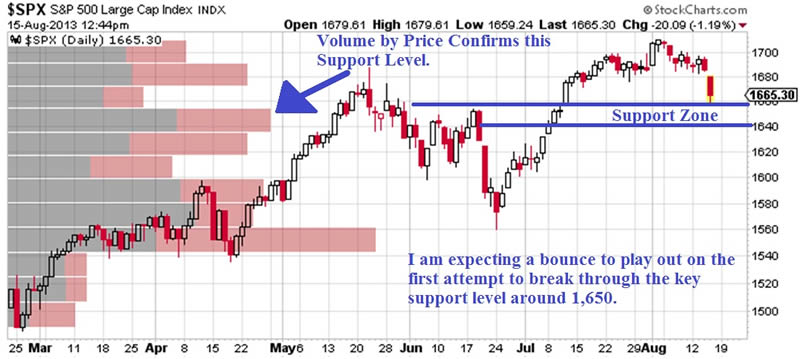
The 1,650 – 1,655 price range on the SPX appears likely to be tested in the near term, possibly as soon as Friday’s close which coincides with the September monthly option expiration.
I would not be shocked to see equity markets bounce back up to test the breakdown we are seeing today. If price cannot push through the resistance overhead and we see a reversal that takes out the 1,650 support level we could see a much larger correction unfold.
The next few trading sessions are going to be important for intermediate price action. As long as 1,650 holds the bulls still have a chance to move prices higher. However, at this point there is likely to be strong resistance around 1,675 on any upside reversals. Risk is high and the 1,650 support level needs to hold otherwise more selling pressure is likely ahead.
 If you are looking for a simple one trade per week trading style then be sure to join www.OptionsTradingSignals.com today with our 14 Day Trial.
J.W. Jones is an independent options trader using multiple forms of analysis to guide his option trading strategies. Jones has an extensive background in portfolio analysis and analytics as well as risk analysis. J.W. strives to reach traders that are missing opportunities trading options and commits to writing content which is not only educational, but entertaining as well. Regular readers will develop the knowledge and skills to trade options competently over time. Jones focuses on writing spreads in situations where risk is clearly defined and high potential returns can be realized.
This article is intended solely for information purposes. The opinions are those of the author only. Please conduct further research and consult your financial advisor before making any investment/trading decision. No responsibility can be accepted for losses that may result as a consequence of trading on the basis of this analysis.
© 2005-2022 http://www.MarketOracle.co.uk - The Market Oracle is a FREE Daily Financial Markets Analysis & Forecasting online publication.