Malaysia's Stock Market and Economy Disconnect
Stock-Markets / Stock Markets 2013 Aug 13, 2013 - 12:14 PM GMTBy: Sam_Chee_Kong
 For the past two decades or so the financial markets have been through tremendous changes. From the open outcry system where stock prices took minutes to arrive are now available on real time in most online systems offered by brokers. What used to be an advantage for those who have access to quicker stock market information is no longer applicable as speed of execution has levelled across all online platforms. Due to the boom in the internet connectivity and the ease of delivery of information through emails, blogs and chat rooms investors are now faced with what is called ‘information overload’. It is a situation where there is more information than we know what to do with it.
Markets today are more volatile and interconnected than it was 10 years ago. Moreover everybody can access the same information as most analysts do and this somehow levelled the playing field. One of the toughest challenges facing investors is keeping up with the trend in the economy and how to use it to aid them in theirs investment decisions. To understand the current and future trend of the economy investors will need to understand some basic economic indicators. Why need to understand the trend of the economy?
A must, as the following economic principle implies.
A strong country = strong currency
A strong economy = strong stock market
This can be interpreted as you need a strong economy to sustain a strong stock market and not the other way round. Since stock prices are boosted by current and future expectations of earnings, without a strong economy how can companies increase and sustain their earnings? When economic conditions are improving people feel more confident and willing to spend more. This will help boost the output of businesses and hence profits which in turn will increase their investments.
The Current Great Disconnect
What is happening around us now is that rallying stock markets around the world are accompanied by improving economic conditions. How can this be? To enable such things to happen the market has to be manipulated. Bad news will be hidden and good news will be released. We all know that such disparities cannot go on forever and the market will sooner or later begins to correct itself until all the excesses are trimmed. Unsuspecting investors will fall into such trap because all they want is the market keep moving up without acknowledging the danger behind it. However as always happened when the market finally turned the retail investors are always the ones that got thrashed.
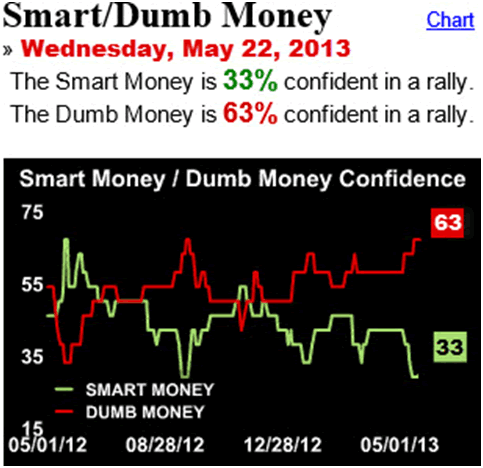
To illustrate our case we present to you the following Smart/Dumb Money indicator which shows how the difference in the confidence level of the smart money and dumb money affects the market index. As can be seen, the few occasions whenever the confidence of both smart and dumb money diverges the market contracts or rally.
This following is the Sentimen Trader Smart/Dumb Money index of S&P 500.
Legend.
Smart Money includes the following.
- put/call options
- commercial hedge positions in futures market by professionals
- stocks and bonds.
Dumb Money includes the following.
- Fund flows into mutual funds
- Retail participation in futures market, stocks and bonds
The divergence in the above ratio shows that the smart money is always doing the opposite of the dumb money. The smart money is confident when the dumb money is fearful and vice versa. As on 05/01/2012 , after a market rout dumb money is seen fleeing the market while smart money is getting in.
Malaysia is not spared of this madness too given our current Stock Market rallied into record territory albeit economic fundamentals are deteriorating. To illustrate our case we present you the chart for the Daily FBM KLCI and related economic indicators.
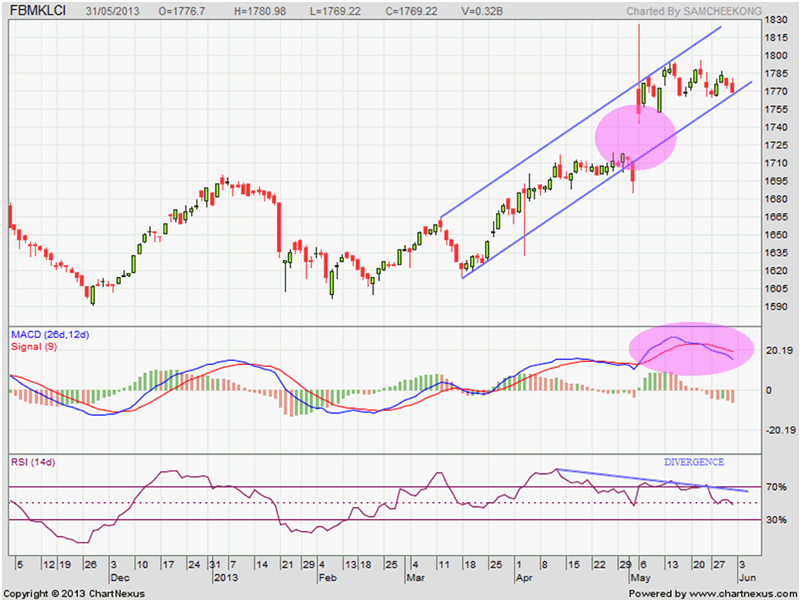
The above is the chart for FBM KLCI as of 31/05/2013 and as you can see the market is trading close to its new high. Again we are sticking to our earlier prediction in our earlier article (Post election rally. Can it Hold?) dated on the 10th May 2013.
We reckoned that the FBM KLCI will have to find its level back to 1712 so as to close the Gap as indicated by the pink circle above. Again there are divergences between the price and indicators chart and this has been going on since last April. We foresee that the risk of market weakening in the coming weeks has increased considerably. Why do we say so?
If you care to notice for the past two trading sessions (30/05/13 and 31/05/13) something fishy happened. After the market closed at 4.45pm and during the 5 minutes window our Plunge Protection Team (PPP) did not do what it is supposed to do - to manipulate the market upwards. In normal days they (PPP) will do the last minute buying to push up the market by a few points. This time however they did not intervene and let the market sink deeper into the red. This let us to conclude that there are some inform investors selling out their positions during the 5 minutes window.
Below are the few selected economic indicators which will have effects on the stock market performance. We are not going to classify them into different categories of economic indicators such as lagging, leading or coincident. Doing this will make it more complicated and will need another article to explain their cause and effect on the economy and the stock market.
We begin with our GDP annual growth rate. The GDP can be defined as the sum of all spending on private and public goods and services, investment and exports minus imports. Or we can put it in an equation form.
GDP = C + I + G + (X – M) where,
C = Consumer or private spending
I = Investment
G = Government spending
X = Exports
M = Imports
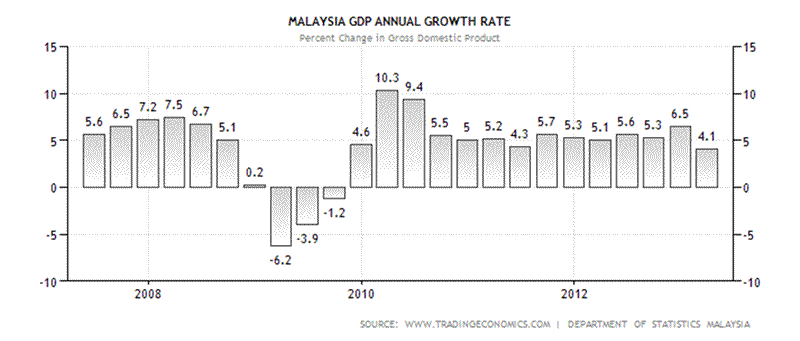
In the first quarter of 2013 Malaysia recorded an increase of 4.1% which can be considered the worst quarter since the last quarter of 2009. The slowdown in the Malaysian economy in the first quarter is attributed to the slowdown in Government spending and exports. Stock market participants prefer to see a rise in the GDP because a healthy economy helped increased the profitability of corporates which in turn will be reflected by increased share prices. On the contrary stock prices will tend to slow when GDP slows in the months ahead.
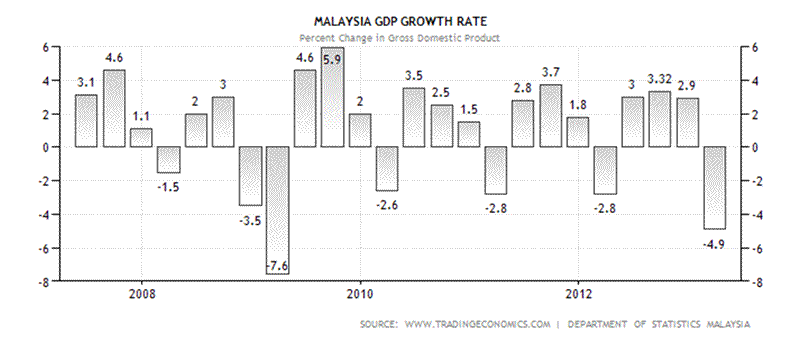
Next is the GDP Growth rate. This is the percentage changed from this quarter compared to the previous quarter. Again this indicator posed a decline of 4.9% as compared to the previous quarter. This also represents the worst performance since the last quarter of 2009. Again the main culprits are same as the above which is the decline of Government spending and exports.
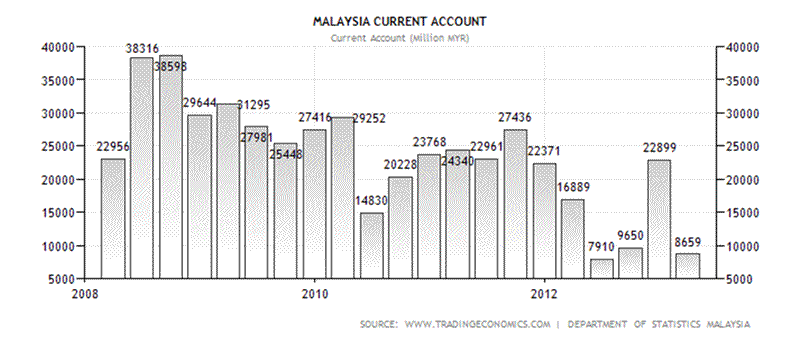
Our third indicator is the Current Account which is part of the Balance of Payments. The current account is the sum of the exports and imports of goods and services. A negative figure denotes imports are greater than exports and vice versa. In the first quarter of 2013, Malaysia recorded a surplus of RM 8659 million which is a big drop from the previous quarter of RM 22899 million. This drastic drop is due to the drop in exports coupled with an increase in imports from RM 44254 million in the last quarter of 2012 to RM 54932 million posted in the first quarter of 2013. Market participants prefer to see a more favourable Current Account as this signifies an improve economic condition which will be good for the stock market.
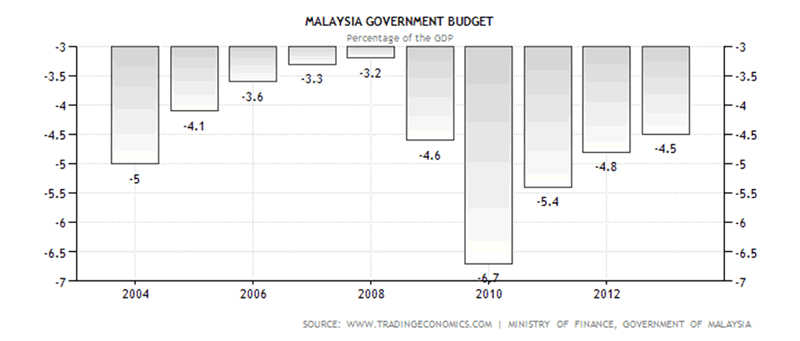
Next is the Government budget. The Government budget is a record of the Government expenditure and revenue over a period normally a year. Our Government is plagued by continued budget deficit. A budget deficit is a situation where our Government spend more than it received and thus we are living off credit nowadays. Malaysia recorded a budget deficit of 4.5% to GDP in the first quarter of 2013 and is considered one of the highest in Asia. To finance its continued deficit spending our government either have to borrow more or increase taxation. The following is the chart for our Government budget deficit as of 2004.
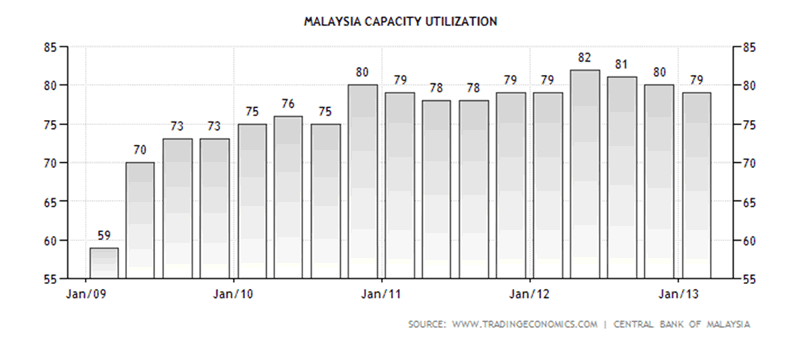
Capacity utilization refers to the actual output produced as compared to the potential output that can be reached. A 100% capacity utilization means full capacity while a 79% capacity utilization refers to under capacity. One reason for the reduction in capacity utilization is due to the decline in future orders. This is one of the leading economic indicators and a decline means that our economic growth is expected to slow down in the coming months.
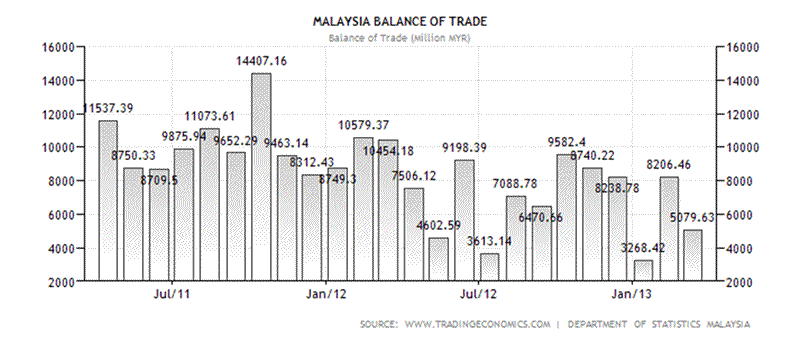
The balance of trade is the difference between exports and imports in monetary terms in an economy over a certain period of time. A positive balance of trade means higher exports value over imports and vice versa. Malaysia recorded a trade surplus of RM 5.08 billion in the first quarter of 2013 but down significantly from the RM 10.4 billion recorded in the same period last year. The main reason is the drop in exports for the drop in exports for the last 2 months. Exports of palm oil and electronic goods recorded a drop in the previous two months. The following is the Balance of Trade chart for Malaysia as of 2011 and it clearly shows that it has been deteriorating since the beginning of 2011.
From the above analysis we can deduce that the Malaysian economy is not at its best condition and in fact it has weakened in many fronts since last year. Moving forward it will be an uphill task for the Malaysian government to stimulate its economy because it has to find the money to finance its fiscal expenditure like the ETP programs which are designed to move the Malaysian economy to the next level. Due to the restriction of Government Debts/GDP to 55% as provided in the Constitution and with the current level for Debt/GDP at 53.2%, there are not much room to manoeuvre.
Hence the option of using monetized deficit financing (through borrowing) being closed it is now left with the choice of using non-monetized deficit financing. Non-monetized deficit financing refers to the method of raising funds from domestic sources other than borrowing. It can be in the form of increase taxes (GST for example) or reducing expenditure from other sources like subsidy reduction. This form of financing is another way of shuffling or redirecting money from the private expenditure to public expenditure without adding anything to the debts.
With the anticipated weaker Malaysian economy in the coming months we are expecting the stock market to perform softer than its current level. Going by the revised EPS of the FBM KLCI to 112 and a P/E ratio of 14.9 as of March 2013, we expect an estimated fair value of the FBM KLCI at the end of 2013 to be lower. The estimation of the FBM KLCI by end of 2013 can be calculated with the following formula.
Market index = Market EPS x Market P/E
Or,
Market index = 112 x 14.9 = 1668.80 points
Given both the regional (Japan) and Global Systemic Risk (U.S and Europe) that cannot be hedged, we reckoned that our domestic market is vulnerable to unforeseen external risk. Therefore the estimated fair value of 1668.80 points based on the expected EPS and P/E ratio is THE BEST CASE SCENARIO.
by Sam Chee Kong
cheekongsam@yahoo.com
© 2013 Copyright Sam Chee Kong - All Rights Reserved
Disclaimer: The above is a matter of opinion provided for general information purposes only and is not intended as investment advice. Information and analysis above are derived from sources and utilising methods believed to be reliable, but we cannot accept responsibility for any losses you may incur as a result of this analysis. Individuals should consult with their personal financial advisors.
© 2005-2022 http://www.MarketOracle.co.uk - The Market Oracle is a FREE Daily Financial Markets Analysis & Forecasting online publication.


