Stock Market 3 Peaks and a Domed House Price Pattern
Stock-Markets / Stock Markets 2013 Aug 07, 2013 - 05:20 AM GMTBy: Ed_Carlson
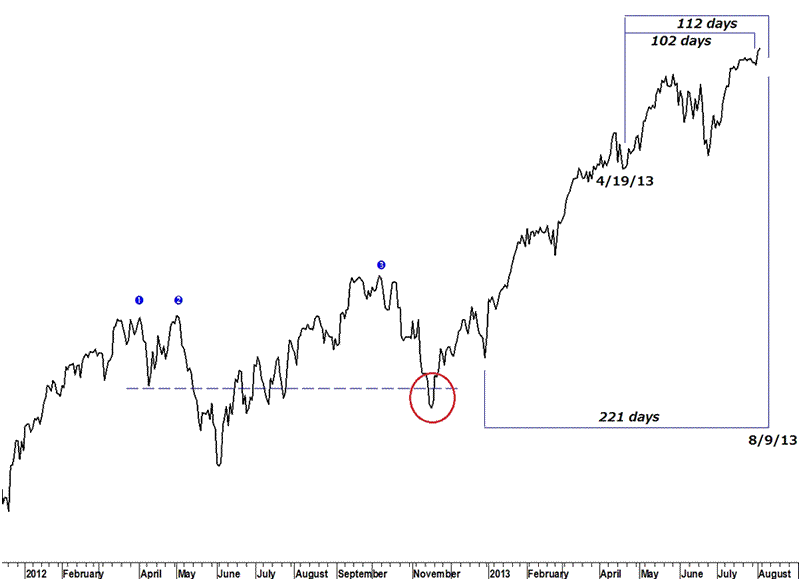
 An odd looking 3PDh pattern has occurred over the last year in the Dow. Lindsay wrote that when these patterns cap secular bull market highs (rather than cyclical highs) they often look atypical.
Three peaks formed on 4/2/12, 5/1/12, and 10/5/12 which meet Lindsay’s requirement that peaks one and three be within 6-10 months apart.
The separating decline following peak three breached the low of the reaction following peak one. A breach of at least one of the reactions following peaks one and/or two is a requirement of the model.
Counting from the “second test of the low” (low of the separating decline) – presumably on 12/31/12 – counts 221 calendar days to 8/9/13 as a possible high.
Lindsay’s 107-day count (a range of 102-112 calendar days) targets a high between 7/30/13 and 8/9/13.

Request your free copy of the August Lindsay Report at http://seattletechnicaladvisors.com/contactus.html
Ed Carlson, author of George Lindsay and the Art of Technical Analysis, and his new book, George Lindsay's An Aid to Timing is an independent trader, consultant, and Chartered Market Technician (CMT) based in Seattle. Carlson manages the website Seattle Technical Advisors.com, where he publishes daily and weekly commentary. He spent twenty years as a stockbroker and holds an M.B.A. from Wichita State University.
© 2013 Copyright Ed Carlson - All Rights Reserved
Disclaimer: The above is a matter of opinion provided for general information purposes only and is not intended as investment advice. Information and analysis above are derived from sources and utilising methods believed to be reliable, but we cannot accept responsibility for any losses you may incur as a result of this analysis. Individuals should consult with their personal financial advisors.
© 2005-2022 http://www.MarketOracle.co.uk - The Market Oracle is a FREE Daily Financial Markets Analysis & Forecasting online publication.


