Japan Hyper QE Inflation Wars, Bank of England's Bail-in Secret, Buy Gold, Silver?
News_Letter / Credit Crisis 2013 Jul 19, 2013 - 05:56 AM GMTBy: NewsLetter
 The Market Oracle Newsletter
April 8th , 2013 Issue # 9 Vol. 7
Japan Hyper QE Inflation Wars, Bank of England's Bail-in Secret, Buy Gold, Silver?
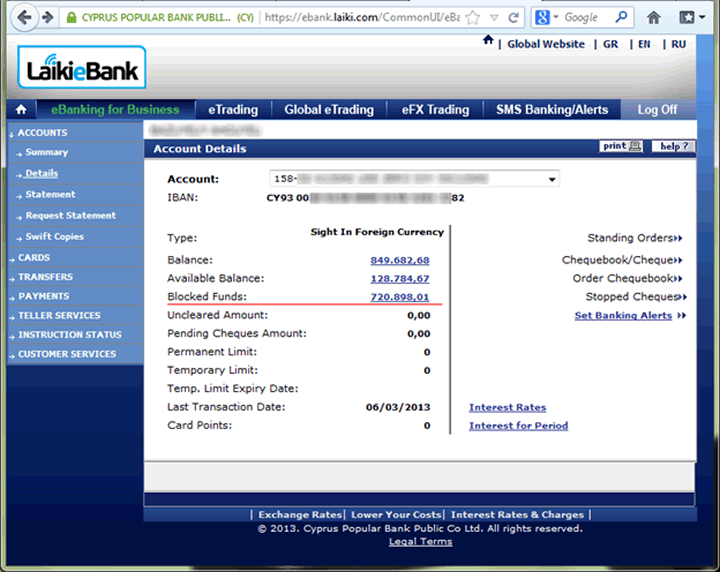
Dear Reader Many Gold and Silver commentators have repeatedly been shocked into silence as their expectations for a mega bull run to $2,000 continues to not only fail to materialise but the market's appear to have gone mad in the wake of Cyprus's banking system exploding in spectacular style resulting in the overt theft of a growing percentage of deposits that could reach as high as 85% as the following real life example illustrates to what an 85% theft of this customers bank balance at Laiki Bank actually looks like -
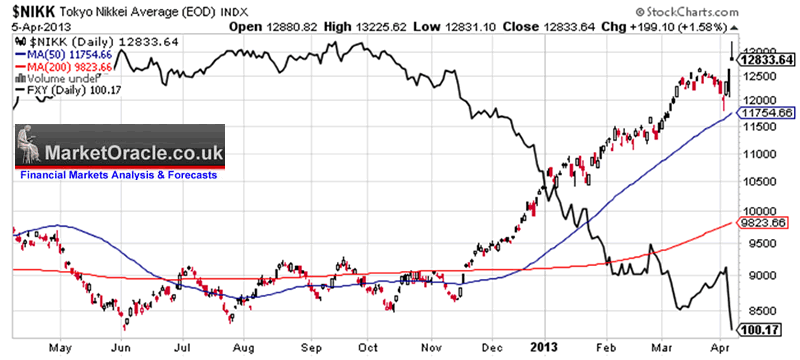
Source - So, What's It Like To Have a Business in Cyprus Right Now? Writes the account owner: "Most circulating assets on our business Current Account are blocked. Over 700k of expropriated money will be used to repay country's debt. Probably we will get back about 20% of this amount in 6-7 years. I'm not Russian oligarch, but just European medium size IT business. Thousands of other companies around Cyprus have the same situation. The business is definitely ruined, all Cypriot workers to be fired. We are moving to small Caribbean country where authorities have more respect to people's assets." The markets in large part appear to have been doing the exact opposite of what many expected them to do as apparently it's the stock market that has proven to be the safe haven and not Gold and Silver which instead in recent days have been dumped by investors to new 2013 lows. As I explained in my article of over a week ago (Cyprus Bank Deposit's Theft Crisis Sparks Run to Stock Market Safe Haven) the reason why the stock market has risen is because - The flight into the stock market at its core represents simple logic that is if investors with funds parked in banks are at the real risk of losing as much as 40% their funds in exchange for a pittance in interest of usually less than 3% per annum (less than Inflation after tax). Then is it not simple logic that dictates that investors should pull their funds out of the banks and park them in SAFER dividend paying blue chip stocks that despite having a similar downside risk i.e. 40% potential loss if the markets crashed, but in exchange for that risk is an dividend income that INCREASES each year PLUS potential of capital gains of probably between 20% to 50% per annum (depending on the individual stocks performance). The consequences of which has been to delay the start of the stock market correction as what we are witnessing are the consequences of seismic shockwave's in depositor perception that is resulting in unpredictable volatility rather than anything that is being driven by fundamentals, however I expect as the dust settles the fundamentals will continue to reassert themselves and those fundamentals at their core are the consequences of the Exponential Inflation Mega-trend towards which all asset prices tend to be leveraged and oscillate around. Japans Hyper QE Since Japan started quantitative easing off some 20 years ago so it should not come as any surprise that it's latest mega-money printing actions could be termed as 'Hyper QE' which illustrates the global inflation mega-trend in progress as it goes that step further than those in the West by announcing that it will seek to DOUBLE Japan's monetary base over the next 2 years that amounts to INFLATING the already QE drenched money supply by an additional £1 trillion, flooding the economy with new money through the mechanisms of mainly buying liquid assets such government & corporate bonds, stocks and sector funds such as the property sector. As an comparison Japan is now printing money at a rate that is more than DOUBLE that of the U.S. which equates to 1% of GDP per month, which converts into potential EXTRA inflation of 12% per annum! Much of which will leak out of Japan and into other world economies. The effect of printing money is the same whether it's in Japanese Yen, British Pounds or US Dollar, and that effect is to inflate asset prices that are leveraged to inflation whilst increasing the rate of free fall of the currency against other fiat currencies which are also in a perpetual state of free fall as all governments are engaged in the same policies of competitive money and debt printing to bribe their respective voters with. The following graph illustrates the effect of run up to the anticipated announcement of further QE which turned out to be double markets expectations hence the further rally in Japanese stocks and plunge in the Yen.
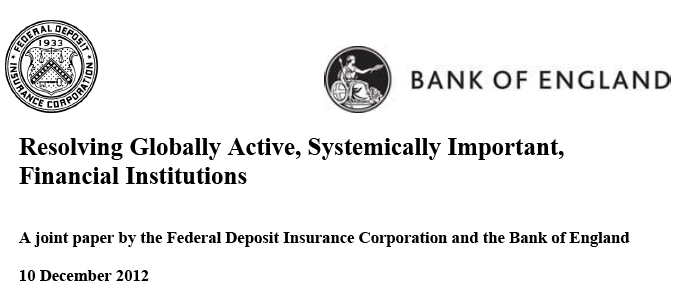
Japan's actions should act as the latest serious wake up call for all investors that governments will literally print an unlimited amount of money which ensures that there can never be deflation as many deflation fools still to this very day continue to beat the non-existant drums of, though I do note that a number of deflationistas' in the face of being wrong for many years have started to pretend that they had been aware of the Inflation mega-trend all along! That should not come as much of a surprise because after Politicians the next biggest liars tend to be salesmen. Off course printing money does not increase wealth, if you pump out money at the the rate of 1% of GDP per month that does not mean that the economy will grow by 1%, all that it means is that it will inflate prices by 1% (per month), and it is asset markets that react first to inflation by virtue of the fact that, that is where it is directed towards and that is what market participants react to in anticipation of future QE i.e. 2 years of 1% per month of money printing Japan style. There can never be something for nothing as it WILL result in inflation of commodity and consumer prices so most ordinary Japanese will feel the negative consequences in their pockets as prices rise, but for Investors who are leveraged to inflation such as stock and property market investors will continue to reap huge rewards far beyond that which is lost to increases in the consumer inflation rates as money printing inflates assets such as stocks all the way to the next bubble far beyond highs that any credible analyst can imagine today, whilst the incredulous perma-bears continue to wait for the bear market to resume despite the fact that stock markets have more then doubled whilst they continue with the perma-bear mantra. See Inflation Mega-trend ebook for wealth protection strategies (FREE DOWNLOAD). As mentioned earlier the effect of Japan's QE will be similar to that of the US in that much of the money will wash around the world being leveraged higher by X10, perhaps X20 to INFLATE ALL ASSET Prices ALL OVER THE WORLD. That and the obvious response of other governments to engage in their own further QE's in an attempt to counter Japan's competitive devaluation of the Yen which is generally termed by the media as the Currency Wars though which should more correctly be termed as Inflation Wars for that is the lasting impact of money printing. Bank of England's Dirty 'Bail-in' Secret You think a Cyprus style theft cannot happen here ? Think again, because when the chips are down and the Government has its back against the wall then it WILL happen and it would be far worse than that which took place in Cyprus for the fact that Britain is NOT in the Euro-zone, therefore our currency would plunge WHILST savings are frozen, whilst the government formulates a hair-cut xx%. The net result would be that ALL Savers would lose, no one would be left standing as inflation would ensure that even if savers escaped the hair-cut they would only get back a fraction of the value of their money after the hair-cut which is why for several years I have been advocating an exodus out of bank deposits and into inflation proof assets such as stocks and since early 2012 property as illustrated by the January 2010 Inflation Mega-trend Ebook (FREE DOWNLOAD). Cyprus is not the guinea pig for something new for ALL central banks including the Bank of England have plans for theft of depositor funds to recapitalize banks in the event of a re-run of 2008 or Cyprus 2013, or the soon to follow Greece, Portugal, Spain, Italy and Ireland. The evidence for this 'bail-in' can be found in the Bank of England's own documents as the following except illustrates from a document dated 10th of December 2012 - http://www.bankofengland.co.uk/publications/Documents/news/2012/nr156.pdf
Resolving Globally Active, Systemically Important, Financial Institutions Executive summary The financial crisis that began in 2007 has driven home the importance of an orderly This paper focuses on the application of “top-down” resolution strategies that involve a single In the U.S., the strategy has been developed in the context of the powers provided by the In the U.K., the strategy has been developed on the basis of the powers provided by the U.K. Both the U.S. and U.K. approaches ensure continuity of all critical services performed by the The above text clearly implies that a bail-in of all creditors will be involved in the case of bankruptcy to recapitalize the bankrupt banks. I won't post the whole document but again refer to an excerpt that makes it clear that only insured depositors will be protected i.e. holdings of less than £85,000 per banking licence. U.K. regime How to Protect Your Bank Deposits From Bank of England 'Bail-in' Theft
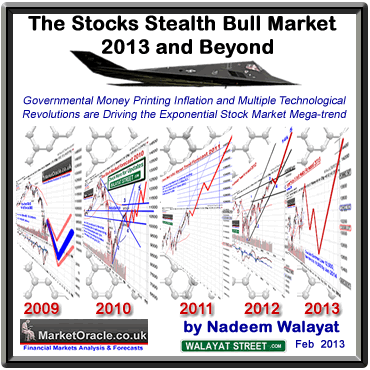
However to protect oneself from the inflation wars one needs to increase ones risk i.e. if you invest in the stock market then you need to appreciate the fact that it will be far higher risk then leaving it in the bank even if you WILL lose at least 2% per annum in the bank. I covered at length how to invest in the stock market including which sectors I expect to outperform over the coming decade in my recent ebook The Stocks Stealth Bull Market 2013 and Beyond (FREE DOWNLOAD). Another key emerging sector that I have been focusing on during the past 18 months has been the property market, specifically UK property as illustrated by the approximate breakdown of my portfolio and where I expect it to be by year end.
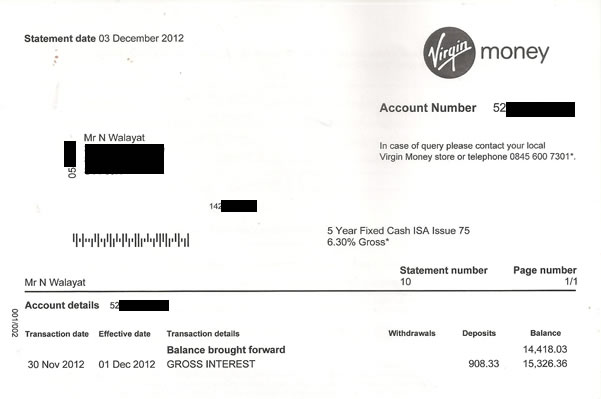
New Tax Year Cash ISA Meanwhile in Britain the new tax year brings limited reprieve for UK savers who continue to have the value of their savings stolen by means of high inflation that tends to be about 1.5% above official CPI rate of 2.8%, i.e. 4%. So whilst many may argue that it is just not worth say putting ones cash into an Cash ISA typically paying less than 3%, especially since Cyprus shows that your savings are NOT safe. However, given that cash is supposed to be the lowest risk holding, so still needs to be part of an overall portfolio so as to balance the risk posed by high risk assets such as stocks. In which respect Cash ISA's obvious advantage is that they are TAX FREE, i.e. depositors can avoid the double taxation on interest theft. So I suggest ISA savers focus on the long-game which is to get as much of your bank deposits into tax free accounts as possible with a view to fixing them at a later date for multiple years as I repeatedly advocated doing in the 6 months leading upto the financial crisis of 2008 - 08 Oct 2008 - UK Interest Rate Forecast 2009 Savers - To reiterate what I have been saying over the last 6 months, savers still have a a golden opportunity to lock in high fixed savings rates which in the UK are above 7% . These rates won't stay around for much longer, were talking perhaps in the days rather than weeks or months. So the time for action is now ! - Yes, banks can go bankrupt but savings are protected which includes accumulated interest. In the UK the protection is for the first £50k per banking group. In which respect I am still personally in receipt of rates of as much as 6.3% per annum on fixed rate cash ISA's taken out during 2008 (non ISA accounts tended to pay 1% more interest per annum), though all of these are now set to mature later this year as illustrated below (Northern Rock ISA- taken over by Virgin):
So where cash ISA's are concerned, play the long-game and wait for savings rates to rise then lock them in for as long as possible to beat both inflation and the tax man. Remember that rates can only remain low as long as the Bank of England retains control of the bond market, which as the euro-zone illustrates that confidence is always fragile i.e. it does not take much to tip bond investor perceptions from low risk to extreme high risk especially as UK, US, German and Japanese bond markets ARE in the mother of all bubbles. In the meantime the likes of Richard Branson's Virgin continues to pay me 6.3%, which is about triple the rate being offered to new Virgin Cash ISA customers. My Cash ISA Strategy The key part of my strategy is to fix with those providers that will charge the least interest for early exit if a series of rate rises are around the corner. For instance Santander charges 120 days interest on its 2.8% cash ISA against Halifax which charges 180days interest for its worse paying 2.5% Cash ISA. Therefore an early exit out of Santander can be entertained when ISA's start appearing offering a rate of 3.8% or higher for an additional ongoing interest of 0.3% per annum (note this is not an endorsement for Santander, but just an example). In Summary
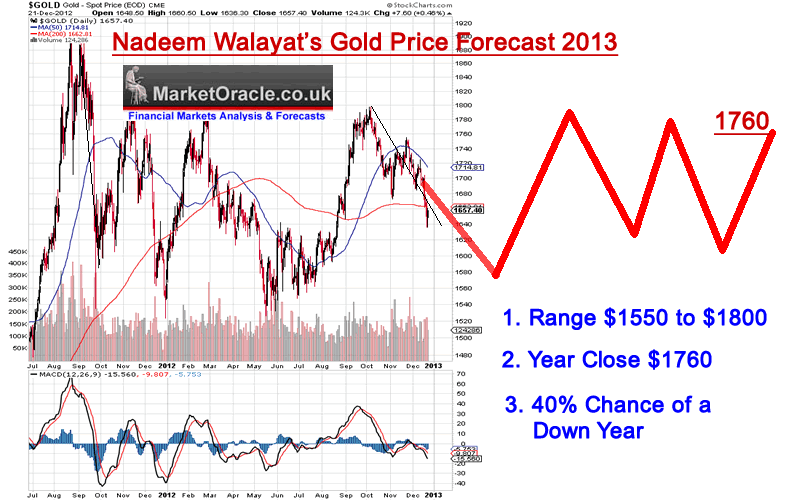
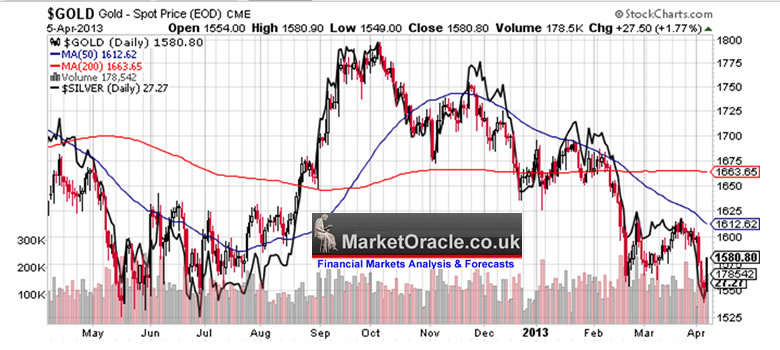
And above all stick to the £85,000 FSCS limit per banking licence. Time to Buy Gold and Silver? If one had gone along with the view of many gold bugs towards the end of 2013 then by now expectations would be for Gold to be trading well above $1,800, instead Gold has been trading at new lows for the year and Silver making multi-year lows with some commentators even suggesting that the Gold / Silver bull market may even be over. My in-depth analysis and concluding trend forecast warned (amidst much criticism) to expect Gold to remain in a trading range for 2013 of between $1800 and $1500 with the immediate trend expected to target a trend towards $1500 as illustrated by the below forecast graph. (24 Dec 2012 - Gold Price Forecast 2013, Buying Opportunity?, is Silver Cheaper?) Furthermore that there was a 40% risk that Gold would close down on the year, whilst net probability favoured Gold targeting $1760 by year end. Therefore with gold having fallen to a low of $1540, and Silver $26.60, then this does appear as an opportunity to accumulate for at least the existing trading range, as expectations now should be for Gold to target the upper end of the range to $1800.
However whilst most eyes are on Gold, I concluded that more volatile Silver is likely to offer a better opportunity to accumulate towards a significantly larger trading range. Silver offers the better long-term opportunity in terms of risk vs reward off of the lows due to expectations for a deeper discount and greater long-term potential. Many commentators have written at length of the risk of Gold and to a lesser extent Silver being confiscated by the government, however the news of Cyprus having shocked the market that bank deposits can also be confiscated which at some point is going to obviously benefit commodities such as Gold and and Silver. Add to that Japan tripling QE money printing that in due course countries such as the UK and US will seek to emulate then that adds to the probability of Silver being at an opportunely priced moment at the low of a 3 year range. Silver Technical Perspective
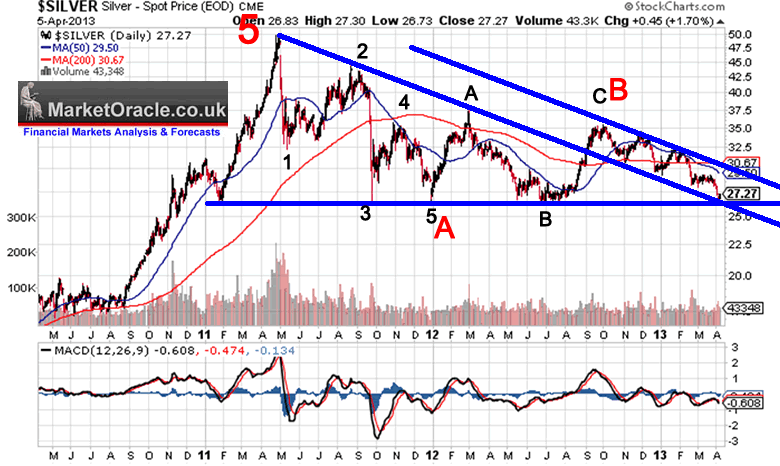
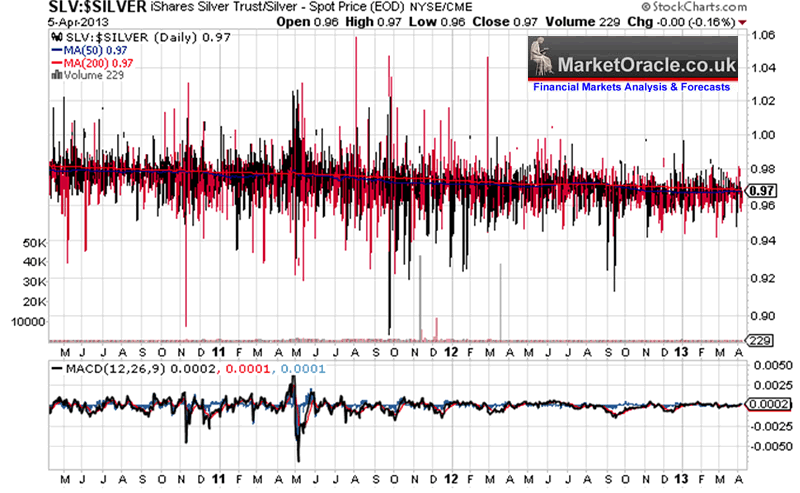
Elliot Wave Theory - Implies Silver has further to fall, i.e. that Silver is in Wave C of a larger ABC that seeks to correct the whole bull market to $48. Trend Analysis - Whilst last Friday Silver strongly bounced off of multi-year lows of $26.60, however the price firmly remains in a down channel that currently has resistance at $30. Support & Resistance - Silver is in a wide trading range of $26 to $35, having recently bounced off the lower end of the trading range. Price Targets - Upside targets are $30, then $35 then $42. Downside $26, $22, $17.5 Inflation Wars - As mentioned earlier in this article as illustrated by Japans Hyper QE, the world economies are engaged in Inflation Wars which inflates ALL asset prices which means sentiment driven leveraged fiat currency liquidity flows buffeting limited supplies of Gold and Silver. Conclusion The bottom line is that Silver tends to be leveraged to Gold towards the later stages of its strong bull trends. Therefore Silver will continue to lag until there is a sustained bull run in Gold first as many precious metal investors will only awake to its relative cheapness after Gold has already moved. As things stand with forecast expectations for Gold to next target $1800, then Silver should eventually follow suite and out-perform on a percentage basis given the more volatile trading range, however at $27, Silver has given no clear sign of a trend change and therefore only indicates as a low trading range longer term investment accumulation opportunity rather than for a large shorter term investing exposure or in terms of position trading. Trading Silver - SLV ETF The SLV ETF shows that it tends to track silver quite closely even over the long-run with very little observed decay, unlike a number of other commodity ETF's such as UNG for natural gas which are designed to lose investors their money. So SLV can be used both for trading and longer term investing purposes.
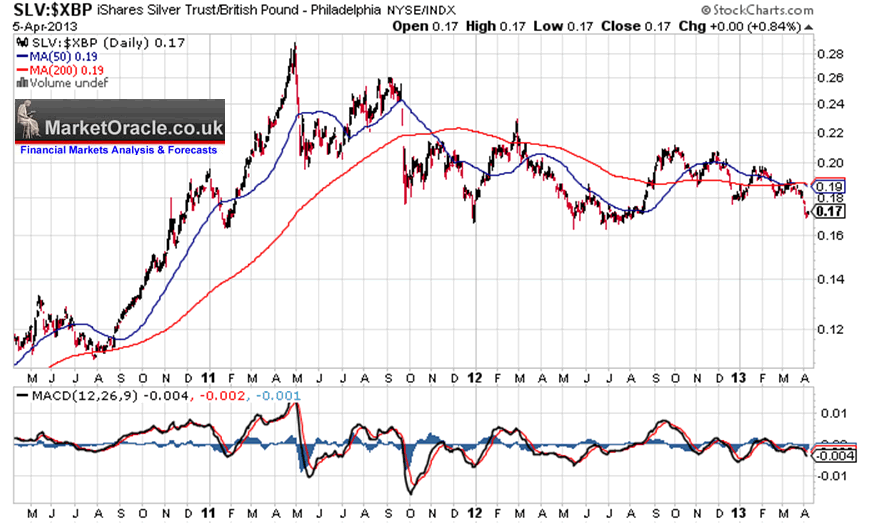
SLV - GBP For sterling investors in commodities such as Silver it is not just good enough to have a rough guide of what the technical picture is for a commodity in terms of dollars but importantly also in terms of ones domestic currency, in which respect the recent downtrend of sterling from £/$1.63 towards £/$1.49 has had the effect of lessening the fall in $SLV, hence why SLV has failed to make a new sterling low.
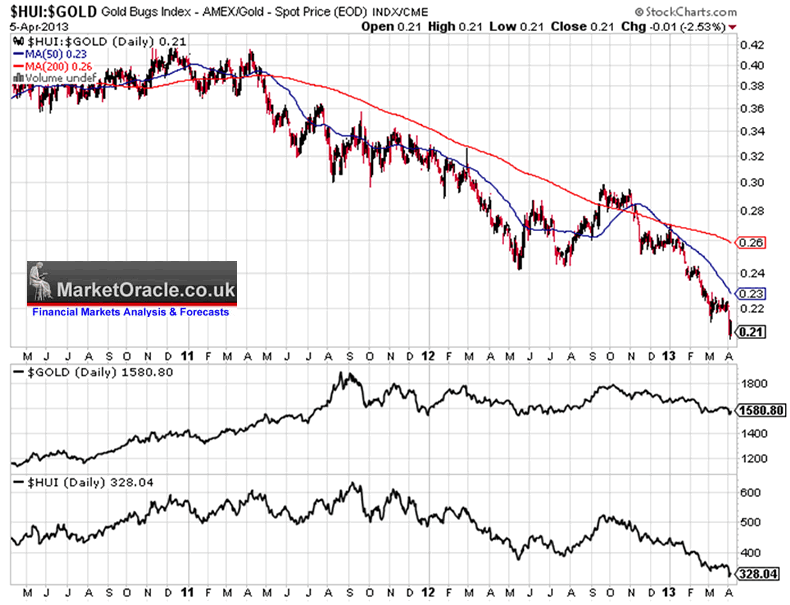
Equally, as Gold and Silver rise it can be expected that the US dollar will weaken which means a significantly weaker sterling SLV rally i.e. spot $ SILVER moving to $35, for a 30% gain translates into a sterling SLV gain of about 20%. Whilst a far more powerful up thrust to SILVER $42 or 55% would translate into GBP SLV gain of about 45%. Whereas the risk is that Silver falls to $17.5 for a risk of 33%, / GBP SLV risk of also 33%. So the potential for a Silver investment now is for about an 50% gain for a 33% risk. In terms of trading silver with a stop at $25.5 for a limit of $42, so a risk of 5% for a 50% gain (10-1). The risk being one is stopped out before the target is reached. What About Gold Stocks? To complicate the picture lets throw Gold stocks into the the mix, which about a 1/3rd of the time are in synch with the gold price, 1/3rd with general stock market indices and 1/3rd just go on a random walk of their own as the following chart illustrates one of severe under performance of the HUI Gold Bugs index against the Gold price.
This explains the reason why Gold stock investors so often get it wong because they cannot detach themselves from what the gold price is doing instead as I often state what one needs to do is to focus on the actual market / stock that one is trading or investing rather than obsessing over an assumed inter-market relationship. The bottom line is that Silver is currently under valued against Gold because Silver lags Gold as it tends to only outperform towards the final blow off stages during which time it catches up to and over takes the Gold price trend. Current price action is near the extreme of under performance against Gold which given the fact that Gold is still in bull market courtesy of the exponential Inflation Megatrend which means that despite lack of any buy signals for trading purposes, Silver is at a point in it's trading range that I personally will to start accumulate a long term position with the goal of ultimately banking profits on a breakout to a new all time high. However, I am not going to speculate on when that could happen because as this analysis illustrates it has far too many obstacles in its way at this point in time i.e. such an event could be 2 to 3 years away. The Inflation Wars simply mean that those that own assets of limited supply get rich whilst those that don't become poor. Margaret Thatcher RIP There would have been no bank bailouts under Thatcher! Many people blame Thatcher in part for our current economic crisis but without Thatcher Britain would not have had an economy to destroy as had Labour won in 1979 then Britain would have drifted to the left of the USSR! Your analyst accumulating Silver for the long-term Inflation Wars Mega Price Spike. Source and Comments: http://www.marketoracle.co.uk/Article39855.html Nadeem Walayat Copyright © 2005-2013 Marketoracle.co.uk (Market Oracle Ltd). All rights reserved. Nadeem Walayat has over 25 years experience of trading derivatives, portfolio management and analysing the financial markets, including one of few who both anticipated and Beat the 1987 Crash. Nadeem's forward looking analysis focuses on UK inflation, economy, interest rates and housing market. He is the author of four ebook's in the The Inflation Mega-Trend and Stocks Stealth Bull Market series.that can be downloaded for Free.
Disclaimer: The above is a matter of opinion provided for general information purposes only and is not intended as investment advice. Information and analysis above are derived from sources and utilising methods believed to be reliable, but we cannot accept responsibility for any trading losses you may incur as a result of this analysis. Individuals should consult with their personal financial advisors before engaging in any trading activities.
You're receiving this Email because you've registered with our website. How to Subscribe Click here to register and get our FREE Newsletter To access the Newsletter archive this link Forward a Message to Someone [FORWARD] To update your preferences [PREFERENCES] How to Unsubscribe - [UNSUBSCRIBE]
The Market Oracle is a FREE Financial Markets Forecasting & Analysis Newsletter and online publication. |
||||||||||||||||||||||||||||||||
© 2005-2022 http://www.MarketOracle.co.uk - The Market Oracle is a FREE Daily Financial Markets Analysis & Forecasting online publication.


