Stock Market Rally Time for a Pause?
Stock-Markets / Stock Markets 2013 Jul 15, 2013 - 04:40 AM GMTBy: Andre_Gratian
 Current Position of the Market
SPX: Very Long-term trend - The very-long-term cycles are in their down phases, and if they make their lows when expected (after this bull market is over), there will be another steep decline into late 2014. However, the severe correction of 2007-2009 may have curtailed the full downward pressure potential of the 40-yr and 120-yr cycles.
Intermediate trend - SPX continues to progress according to its structure. After a brief consolidation, the bull market has resumed its uptrend and has already caused new highs in the leading indices.
Analysis of the short-term trend is done on a daily basis with the help of hourly charts. It is an important adjunct to the analysis of daily and weekly charts which discusses the course of longer market trends.
Daily market analysis of the short term trend is reserved for subscribers. If you would like to sign up for a FREE 4-week trial period of daily comments, please let me know at ajg@cybertrails.com
TIME FOR A PAUSE?
Market Overview
What resistance? The various trend lines clustering around SPX 1634 were no match for the buyers expecting the Fed to modify its previous stance on its credit policy. And they were right! In its news conference Wednesday afternoon, Chairman Bernanke announced that the Fed had no intention of raising interest rates anytime soon. This caused a big opening on Thursday which broke through all the above resistance and confirmed a renewed intermediate uptrend by decisively overcoming the 1655 level. This is what internals look like.
Structure: Intermediate wave V is now in full swing, but we may be at the top of a wave of lesser degree.
Breadth: The McClellan Summation Index has reversed its course and, judging by its RSI, is only half-way in its new uptrend. Short-term, my A/D oscillator is overbought and should correct.
P&F - Fibonacci projection: There is a P&F projection to 1692 which could bring about the completion of minor wave 3 of intermediate V.
Support/resistance zones: By moving above 1655, SPX has confirmed that it is in an intermediate uptrend. 1645-1655 is now a strong support zone, and the last resistance point is the former high of 1687.
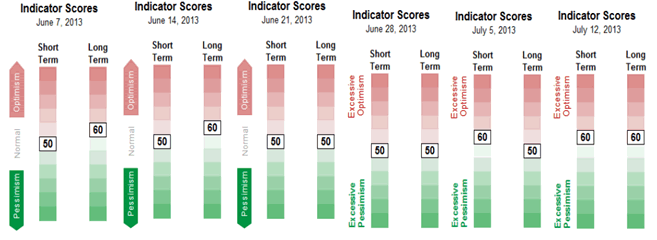
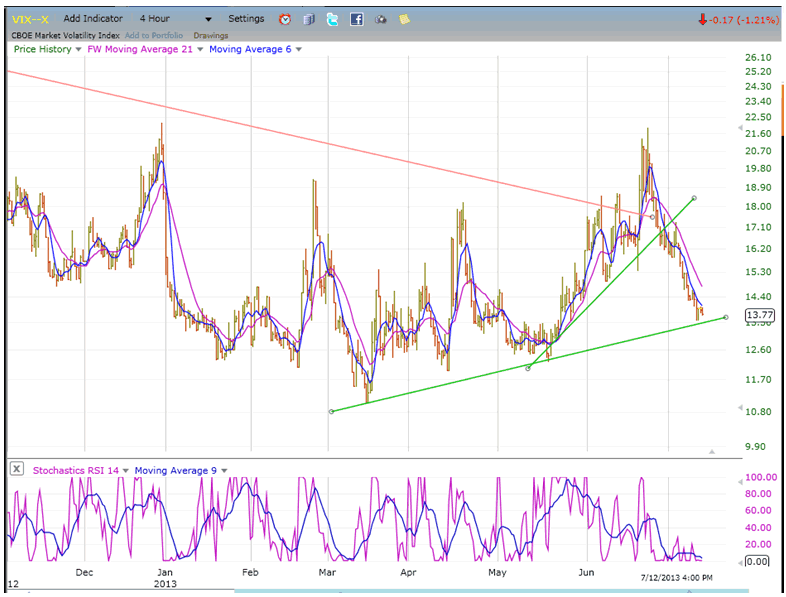
Sentiment: The SentimenTrader has moved up a tick to 60. VIX Closed the week at 13.84 but could decline all the way to 11.00 before it finds support.
Chart Analysis
The following is a daily chart of the SPX (courtesy of QChart). Last week, I spoke of hurdles that the index would have to overcome before we could state with conviction that SPX was back in an intermediate uptrend. As you can see on the chart, it passed its test with flying colors. Undoubtedly, some were already informed of the Fed chairman's intentions.
There is little left to keep the index from making a new high, and the 1692 projection looks as if it could be only the top of minor wave 3. The only uncertainty remaining is whether minute wave 3 was completed at 1679 on Friday, and will bring about a minor correction before the higher target is reached. The move from 1560 has formed a very tight channel similar to the final wave going into the 1687 high. The index is now close to the top of that channel, should find some resistance in that general area, and pull-back, but it may not break out of the channel until after wave 3 is in place.
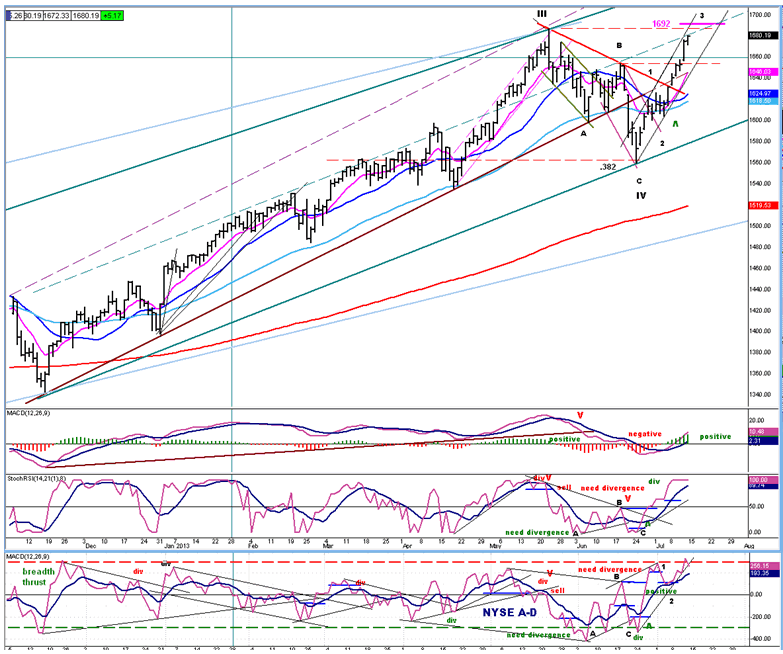
All the indicators have gone positive with MACD being the laggard, as usual. It may show some meaningful negative divergence as we approach the top of the move, but the current display is nothing to worry about since it is still climbing and expanding the distance between its two MAs. What may be a minor concern is the fact that the A-D indicator has become overbought, which normally leads to a 3 or 4-day correction. It's also a good bet that it has now reached peak breadth momentum and will start going into a controlled decline until it reaches the 0 line. At that stage, it should be close to signaling the market top. The SRSI is also very overbought and needs to correct, but only when it shows some negative divergence with price should we expect more than a 3-4 day correction. When these two indicators go negative they should signal a potential high for the move. We are probably still at least two weeks from that time frame, and this will be plenty of time for the SPX to reach its full rally potential (final price objective reserved for subscribers).
The hourly chart (also courtesy of QChart) gives us a more detailed view of the move from 1560. I have a Point & Figure target of 1692 marked on the chart which I expect will be the top of minor wave 3. I also believe that the top of minute wave iii may have been reached on Friday, leading to a minor correction for minute iv. If I am right, the steepest trend line should be broken with a retracement down to the 1655 support level or thereabouts, and to the lower channel line. We may break slightly outside of the channel, but a decisive move outside of it is reserved for minor wave 4.
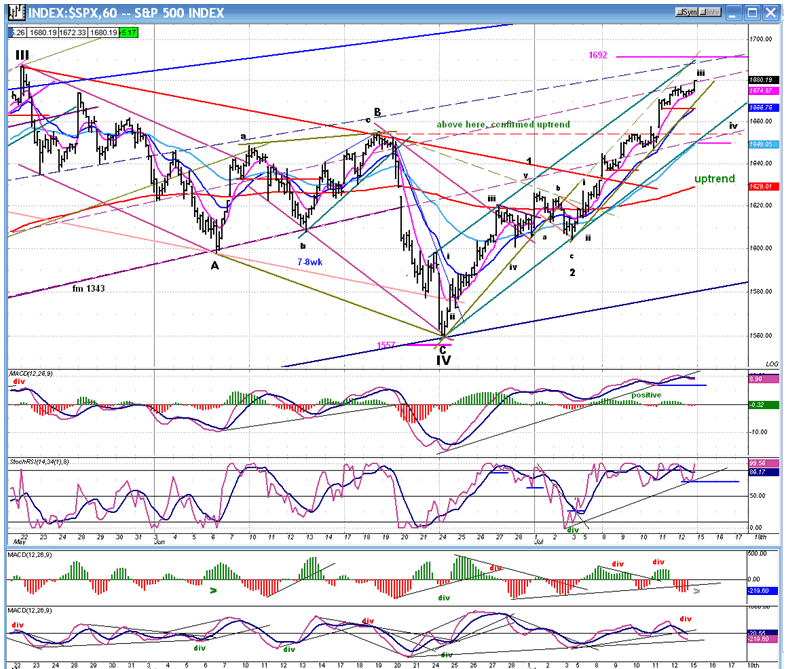
There are a couple of reasons why I sense that a near-term top was reached on Friday -- or may occur first thing Monday morning. On Thursday, an interim P&F count of 1676 was reached, after which the index created a little shelf that helped it push to 1679 -- and perhaps even to 1682 -- before a reversal took place. That last little surge to 1679 was the result of the brief short-covering spurt which normally takes place during the last half-hour on Fridays.
Another reason is the position of the indicators. The momentum indicator has already tried to sell off twice, but good buying - reflected in the A/D figures - sent the market higher. On that last little spurt to 1779, the A/D barely managed to get positive with a final reading of 28. That is negative divergence about as bad as it ever gets.
Nevertheless, until that secondary trend line is broken there is no confirmation and all we have are conditions that are ripe for a reversal. A drop below 1672 will be necessary to confirm the start of a minor correction.
Cycles
The 7-8 week cycle may bottom during the week of 7/22, and it could mark the completion of minor wave 4.
Breadth
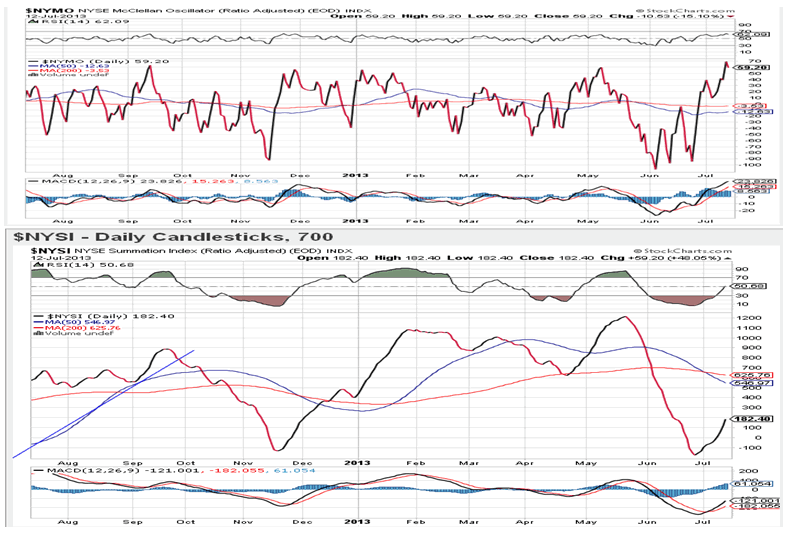
The McClellan Oscillator and Summation Index appear below (courtesy of StockCharts.com).
In November of last year, the McClellan Oscillator became very oversold, sending the Summation Index down to -100. The same levels were reached by both indicators last month and both indicators have now reversed their trends. On Thursday, the McClellan oscillator reached a level which is considered overbought and from which it normally retraces. There are 4 former peaks in the past year which show reversals after reaching that level.
The first reversal will not bring a steep decline in the market. This will be a gradual process during which the NYSI RSI becomes overbought and remains overbought for one or two weeks before turning down and signaling a reversal. As of Friday, it had only retraced half of its range.
Sentiment Indicators
The SentimenTrader (courtesy of same) has now settled at 60, one notch above neutral. Each consecutive top will probably require a higher reading, so we may see 70 and even reach 80 before this indicator signals the end of intermediate wave V.
VIX
With the breakout in the market, VIX has retreated sharply from its high point. As the market continues its rally, it should continue to decline, perhaps to a potential target of 11. When it gets in that vicinity, it will be time to look for divergences to form as one of several indications that a market trend reversal is about to take place
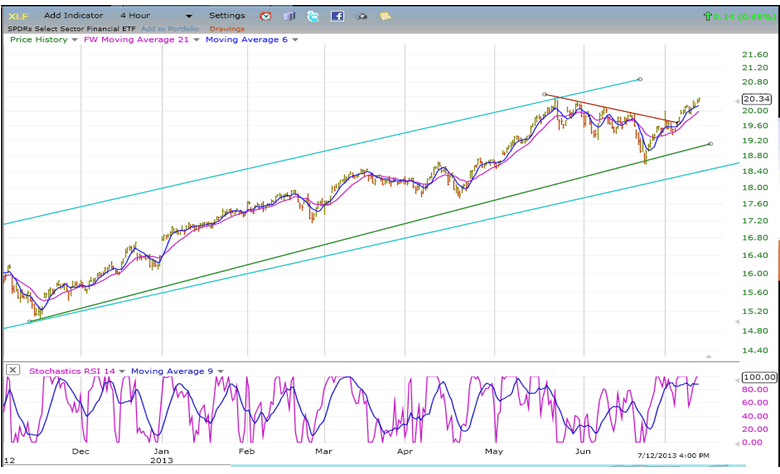
XLF (Financial SPDR)
Once again, the hesitation in XLF which briefly caused it to lag the SPX has been erased by some catching-up action. The financial index is now back in sync with the latter.
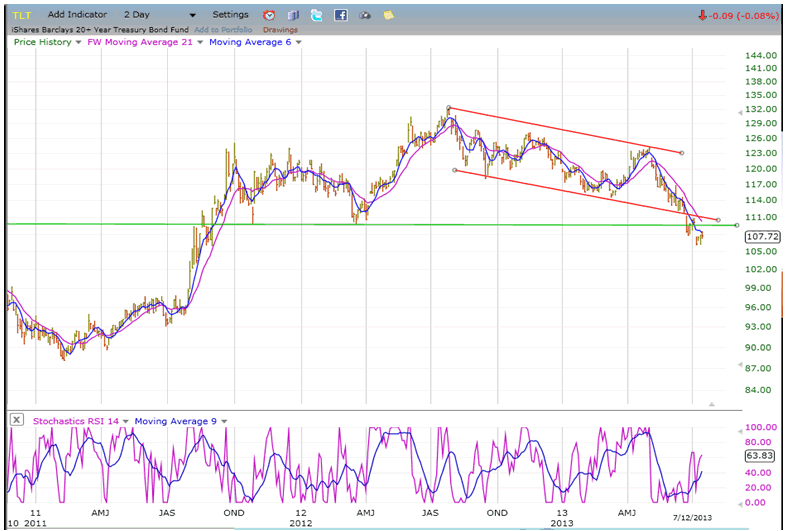
BONDS
Every week seems to bring a new low to TLT. Assurances given by the Fed chairman that it had no intention of raising interest rates anytime soon has not fooled the bond market. It knows that its place in the sun is long past and that it faces a long period of head winds as the economy continues to strengthen. At best, TLT can expect occasional pauses in its developing long-term downtrend.
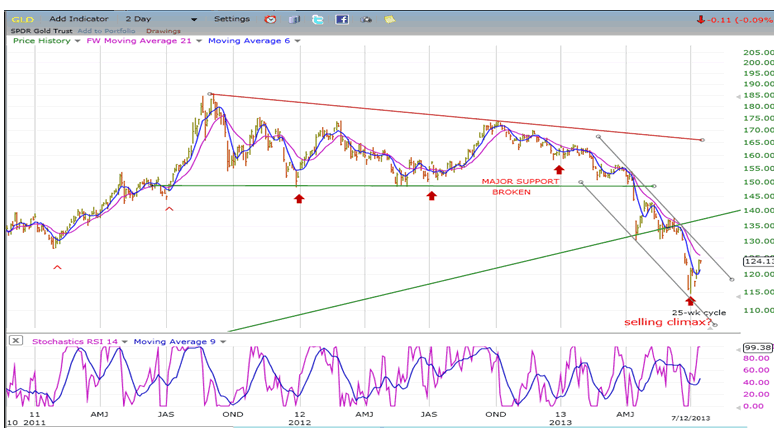
GLD (ETF for gold)
Because it was more oversold than bonds, GLD did acknowledge the Fed's announcement with a decent rally. It may also be benefiting from the bottoming of its 25-wk cycle which appears to have come a couple of weeks late. But solid projections to 110 - if they prove to be correct - will be a limiting factor in any attempt to turn this downtrend rally into anything more than that. From a structural standpoint, it also looks as if GLD may be in a wave 4 with 5 yet to come.
UUP (dollar ETF)
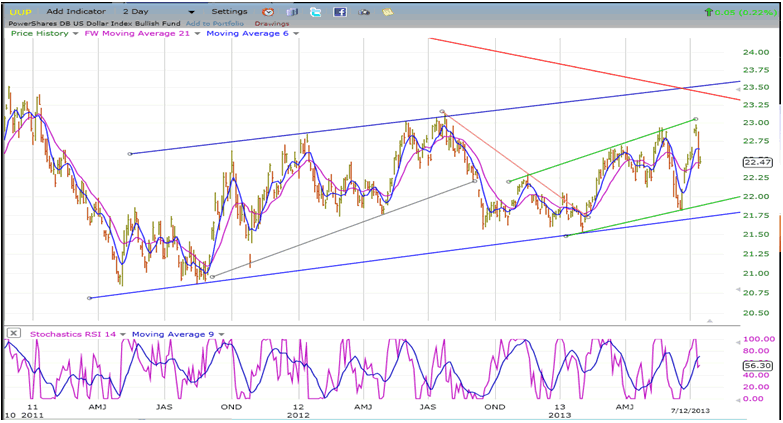
UUP's rally was stopped in its tracks by Bernanke's press conference. However, it's probably only a matter of time before it resumes its uptrend. As the economy continues to strengthen, so will the price of UUP continue to appreciate.
USO (United States Oil Fund)
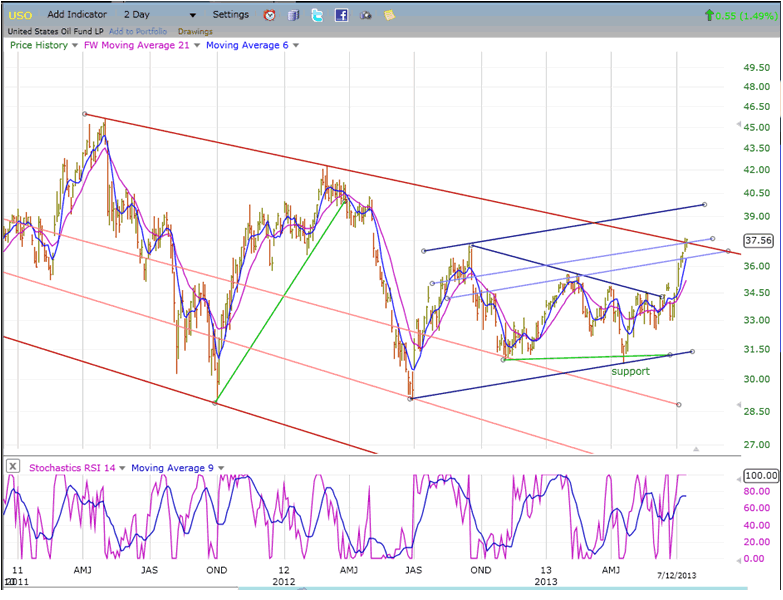
USO's rise was triggered by the Egyptian crisis. It may still benefit from the on-going bull-market, but it has reached an important trend line which could turn back its attempt at developing a full-blown uptrend. Looking at the P&F chart, however, USO has established a nice base which should allow it to move at least 4 points higher and perhaps more. The index also appears to have made a reverse H&S formation during its basing period. This, too, should ensure higher prices for USO.
Summary
There is no longer any question that the bull market is still alive and well. While SPX and DJIA are somewhat lagging, Russell 2000 has surged to a new all-time high and looks unstoppable. NDX is close behind with a recovery high since its peak in 2000. With such leadership, it's only a matter of time before SPX and DJIA follow suit with new all-time highs of their own.
As always, it will not be a straight up to the top affair. There will be some corrections in the uptrend, and there are signs that one of those -- a minor one -- could be imminent.
FREE TRIAL SUBSCRIPTON
If precision in market timing for all time framesis something that you find important, you should
Consider taking a trial subscription to my service. It is free, and you will have four weeks to evaluate its worth. It embodies many years of research with the eventual goal of understanding as perfectly as possible how the market functions. I believe that I have achieved this goal.
For a FREE 4-week trial, Send an email to: ajg@cybertrails.com
For further subscription options, payment plans, and for important general information, I encourage
you to visit my website at www.marketurningpoints.com. It contains summaries of my background, my
investment and trading strategies, and my unique method of intra-day communication with
subscribers. I have also started an archive of former newsletters so that you can not only evaluate past performance, but also be aware of the increasing accuracy of forecasts.
Disclaimer - The above comments about the financial markets are based purely on what I consider to be sound technical analysis principles uncompromised by fundamental considerations. They represent my own opinion and are not meant to be construed as trading or investment advice, but are offered as an analytical point of view which might be of interest to those who follow stock market cycles and technical analysis.
Andre Gratian Archive |
© 2005-2022 http://www.MarketOracle.co.uk - The Market Oracle is a FREE Daily Financial Markets Analysis & Forecasting online publication.


