


Stock Market Rally on Steroids
Stock-Markets / Stock Markets 2013 Jul 14, 2013 - 12:43 PM GMTBy: PhilStockWorld

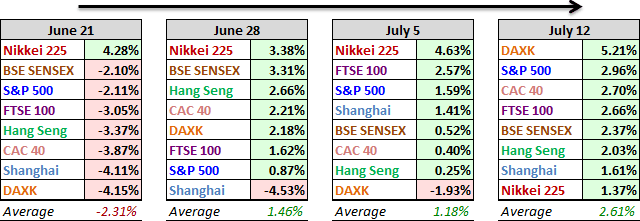
 Courtesy of Doug Short writes: The global rally for my featured group of eight indexes has entered its third consecutive week, and all eight posted gains, something that had happened only twice previously in 2013. Germany’s DAXK was by far the top performer with a 5.21% gain. In distant second, the S&P 500 rose 2.96%. At two decimal places France’s CAC 40 nosed out the UK’s FTSE 100 for third: 2.70% versus 2.66%. After three weeks as the top performer, Japan’s Nikkei came in last but with a respectable 1.37% gain. In fact, year-to-date, the weekly average of the eight indexes at 2.61% is second only to the 2.75% weekly average on the first Friday of 2013 (which carries the asterisk of having begun on the last day of 2012).
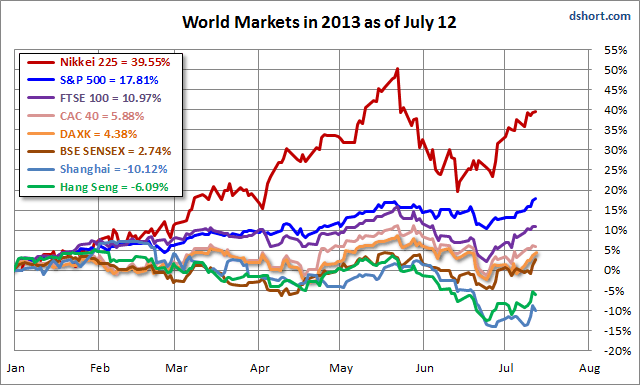
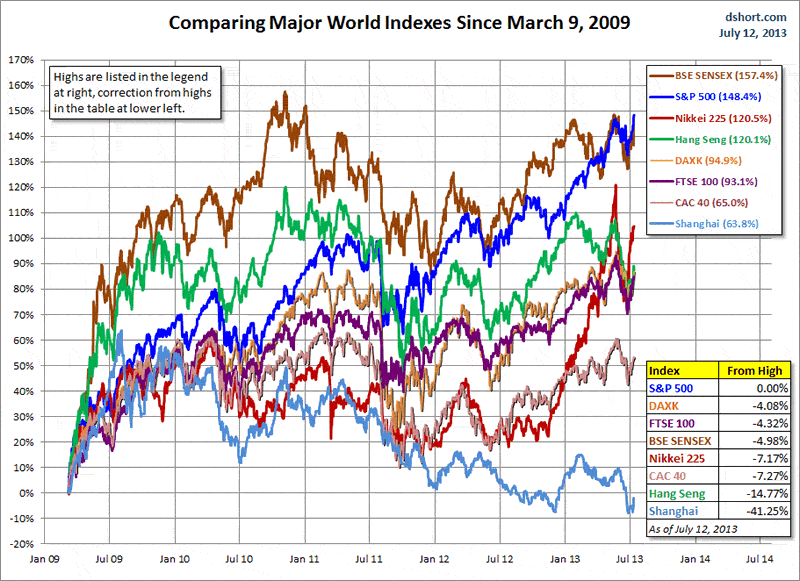
The Shanghai remains the only index on the watch list in bear territory — the traditional designation for a 20% decline from an interim high. See the table inset (lower right) in the chart below. The index is down a depressing 41.25% from its interim high of August 2009. The S&P 500, on contrast set another all-time high on Friday. The surge in the DAXK moved it from fifth to second place in this comparison.
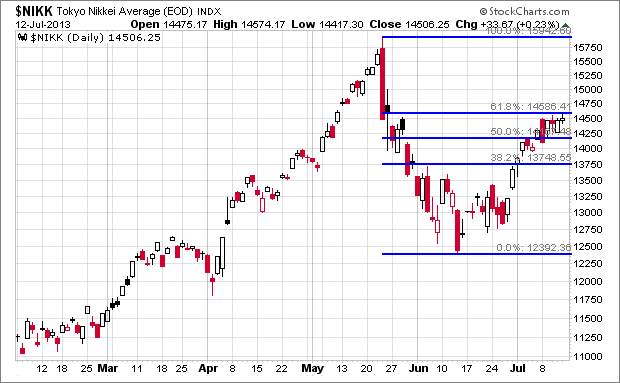
Here is a closer look at the YTD performance, which, more than anything, illustrates the power of Abenomics to levitate the Land of the Rising Sun to its interim high on May 22, followed by a sudden and dramatic selloff and a Fibonacci-like recovery with dizzying volatility.
I’m not a market technician, but after looking at the chart above, I took a moment to annotate a log-scale Nikkei daily with Stockchart’s nifty Fibonacci retracement tool. The result was pretty amazing. It will be interesting to see if Friday’s high continues to be a level of resistance.
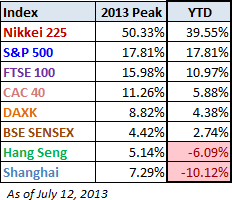 Here is a table highlighting the 2013 year-to-date gains, sorted in that order, along with the 2013 interim highs for the eight indexes. The strong performance of the Japan’s Nikkei over the past few months, despite its big correction, puts it solidly in the top spot with a 39.55% YTD gain, but well off its 2013 peak gain of 50.33%. There are two indexes in the red YTD (the two from China) down from three last week, with the DAXK’s strong week lifting it back into the green.
A Closer Look at the Last Four Weeks
The tables below provide a concise overview of performance comparisons over the past four weeks for these eight major indexes. I’ve also included the average for each week so that we can evaluate the performance of a specific index relative to the overall mean and better understand weekly volatility. The colors for each index name help us visualize the comparative performance over time.
The chart below illustrates the comparative performance of World Markets since March 9, 2009. The start date is arbitrary: The S&P 500, CAC 40 and BSE SENSEX hit their lows on March 9th, the Nikkei 225 on March 10th, the DAX on March 6th, the FTSE on March 3rd, the Shanghai Composite on November 4, 2008, and the Hang Seng even earlier on October 27, 2008. However, by aligning on the same day and measuring the percent change, we get a better sense of the relative performance than if we align the lows.
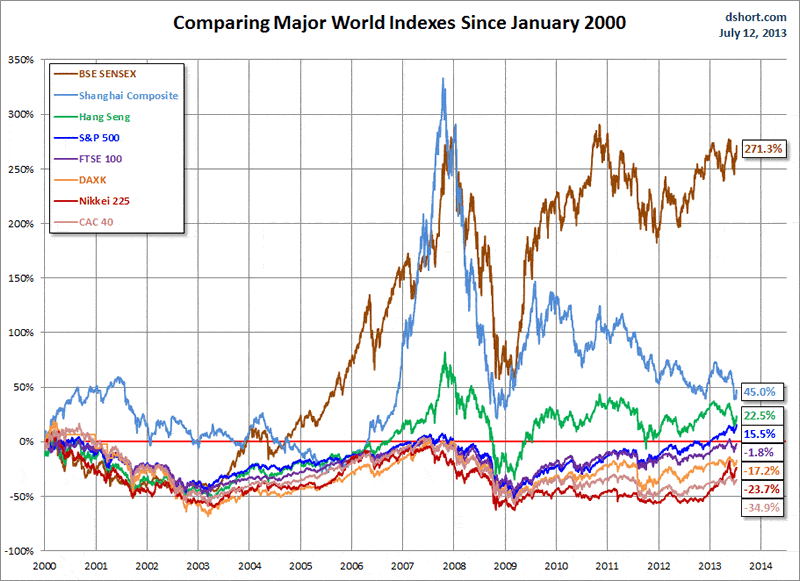
A Longer Look Back
Here is the same chart starting from the turn of 21st century. The relative over-performance of the emerging markets (Shanghai, Mumbai SENSEX, Hang Seng) up to their 2007 peaks is evident, and the SENSEX remains by far the top performer. The Shanghai, in contrast, formed a perfect Eiffel Tower from late 2006 to late 2009.
Check back next week for a new update.
CHARTS: http://stockcharts.com/public/1269446/tenpp
http://caldaroew.spaces.live.com
After about 40 years of investing in the markets one learns that the markets are constantly changing, not only in price, but in what drives the markets. In the 1960s, the Nifty Fifty were the leaders of the stock market. In the 1970s, stock selection using Technical Analysis was important, as the market stayed with a trading range for the entire decade. In the 1980s, the market finally broke out of it doldrums, as the DOW broke through 1100 in 1982, and launched the greatest bull market on record.
Sharing is an important aspect of a life. Over 100 people have joined our group, from all walks of life, covering twenty three countries across the globe. It's been the most fun I have ever had in the market. Sharing uncommon knowledge, with investors. In hope of aiding them in finding their financial independence.
Copyright © 2013 Tony Caldaro - All Rights Reserved Disclaimer: The above is a matter of opinion provided for general information purposes only and is not intended as investment advice. Information and analysis above are derived from sources and utilising methods believed to be reliable, but we cannot accept responsibility for any losses you may incur as a result of this analysis. Individuals should consult with their personal financial advisors.
Tony Caldaro Archive |
© 2005-2022 http://www.MarketOracle.co.uk - The Market Oracle is a FREE Daily Financial Markets Analysis & Forecasting online publication.