New Dow High as Another Stocks Bear Market Goes Up in Smoke
Stock-Markets / Stock Markets 2013 Jul 12, 2013 - 03:32 AM GMTBy: Nadeem_Walayat
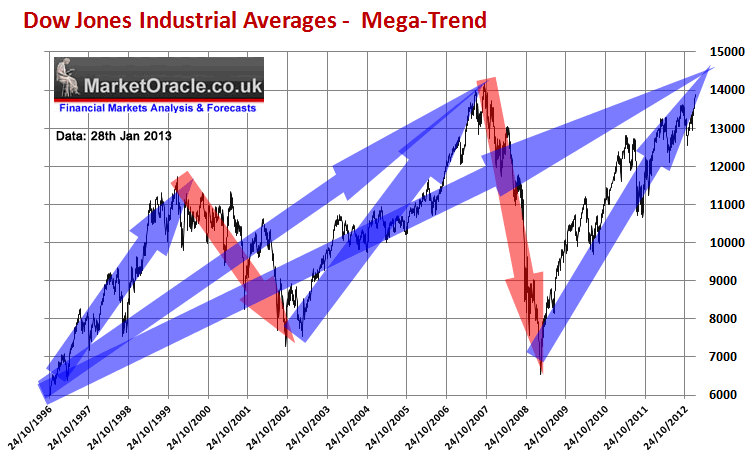
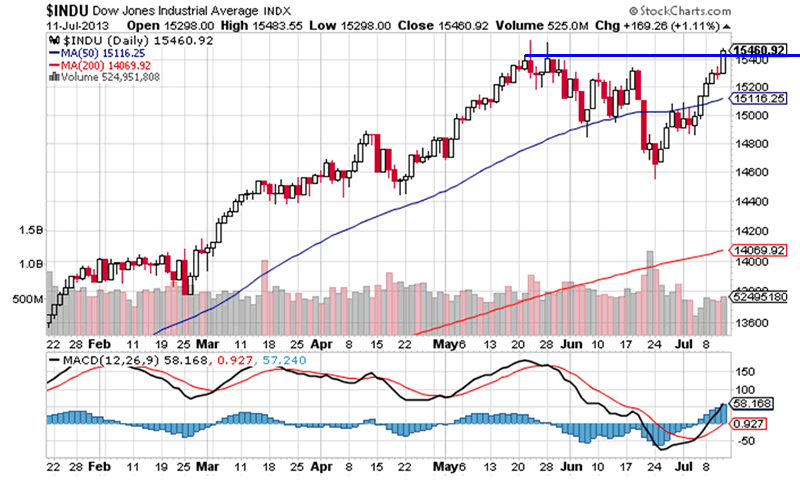
 Dow Jones surges to a new all time closing high of 15,460.92 as many market commentators literally never learn! And there is a reason for this.
Bull markets do one thing, and one thing only, they resolve to NEW bull market highs, as that is what ultimately defines what a bull market is, and so the market that I have traded for near 30 years, the DJIA stock index has once more resolved to a new bull market ALL Time High.
My expectations at the time of the May rally were to reduce stock market exposure ahead of a correction to once more accumulate into - 22 May 2013 - Dow, FTSE, Stock Market Panic, Euphoria, Irrational Rally Continues, What I am Doing
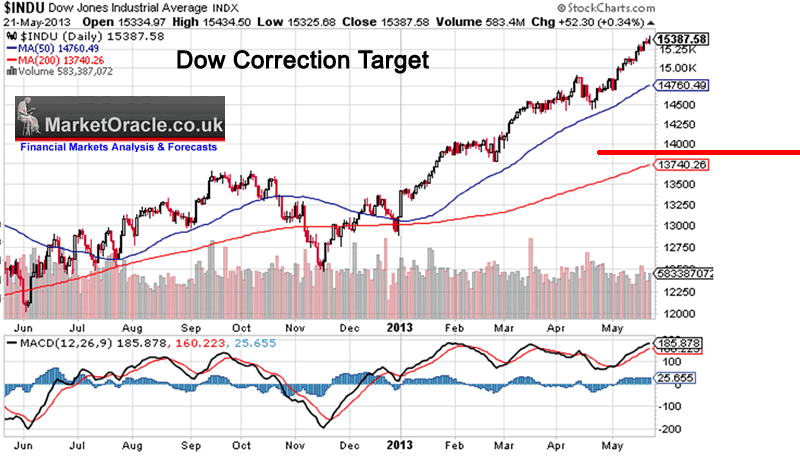
Meanwhile those that clearly have a psychological blind spot towards being on the right side of a trend, continuously repeat the same behaviour pattern of betting against the trend as evidenced by the fact that the deeper the recent correction progressed the more vocal they became in their utterances for an end of the bull market that they were never even able to recognise as a bull market by virtue of what I deem to be ridiculous statements such as that of saying that the stock market bull run of 5 years had just been a cyclical event within a secular BEAR market. Despite the fact that you will have heard the SAME garbage for over FIVE YEARs now!
To reiterate once more, there is no cyclical or secular ONLY BULL or BEAR, only LONG or SHORT, either that or as is more probably the case those that are most vocal commentators NEVER actually TRADE or INVEST with their OWN money! That is self evident in the fact that had they traded with their own money, then by now they would have gone bust several times over!
To become a successful investor or trader, apart form committing a lot of time in testing of hypotheses rather than taking conventional wisdom for granted such as many of the price patterns and indicators that do not match reality such as the oft mentioned head and shoulders pattern, hindenberg omen, elliott wave theory, 90% of gann analysis or the whole area of cyclical analysis which in my 30 years of market experience NONE of which stand up to real time testing.
If you want to learn to trade then you have to realise the fundamental fact that Technical Analysis is a RED HERRING ! It is purely a sales industry that I have seen explode over the past 30 years.
When I started trading in the mid 1980's technical analysis was barely visible, and thankfully so for I learned to trade BEFORE I learned TA!
My recent ebook reiterated at length what I consider to be the real secrets for successful trading which you can download for FREE! For the primary mechanism for being to be on the right side of the market is to be conditioned by the market through the mechanism of profit vs losses. If you don't trade or invest then you will never have a clue, which is why journalists, economists and the TA sales industry cannot even get things right by looking in the rear view mirror to explain what has already happened let alone what probabilities imply is likely to happen going forward! Know this that the media can always find a reason in hindsight but the same reason can and usually IS used to explain either rally's or drops, which illustrates just how clueless the mainstream financial press tends to be!
Read my FREE ebook now to find the truth about the holy grail of Technical Analysis.
The bottom line is this when I am wrong, I lose money, I feel pain, therefore I am conditioned by the market to reduce the probability for being wrong, which means I learnt that approx 90% of TA is garbage, in fact a coin flip gives a greater probability of success than that which 90% of TA will deliver. Which explains why approx 90% of traders lose.
To understand this is to drop the baggage of trying to pretend that knowledge is the key to successful trading when instead the exact opposite is true!
Now, take a deep breath, get out some chart paper, hand draw a chart on ONE market and start to learn to trade by reacting to price movements in real time, for everyone's perception of market price movements in real time will differ.
In terms of the stock market, whilst my focus is on the housing market, I am still targeting to have 20% of my wealth invested in stocks by the end of this year (current 16%).
My simple investing strategy for the duration of the bull market from the March 2009 bear market bottom has remained the same which is - The greater the deviation from the bull market high then the greater the buying opportunity presented.
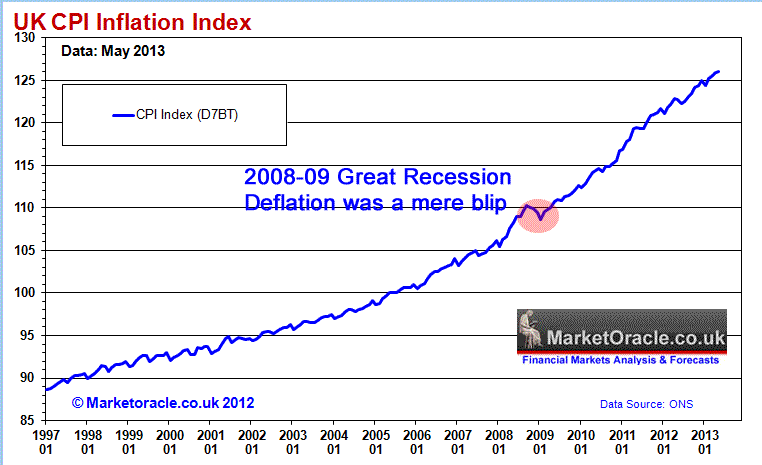
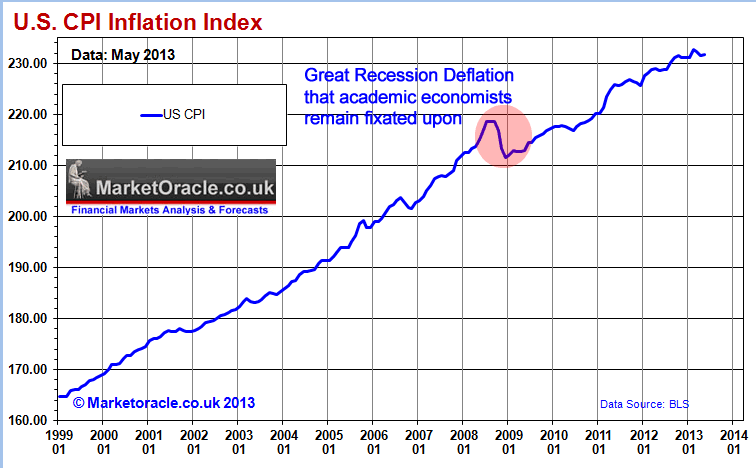
Meanwhile so called expert commentators blinded by non-existant deflation into final top scenarios such as the Broadening stock market top will once more hibernate until the next correction comes along, as they remain completely ignorant of the consequences of the exponential Inflation Mega-trend which itself is a consequence of rampant exponential central bank debt and money printing that ensures that whilst stock prices may not have budged much against PAST stock market peaks but VALUATIONS have !
There is a simple tool available to help protect yourself from 90% of the garbage out there and it is called GOOGLE. Google what the so called expert stated would happen in 2012, 2011, 2010 and 2009 and then you will learn the truth of what amounts to mindless regurgitative deflationary drivel. For they fail to understand the fundamentals. The fundamentals of what actually drives western society, that of a system built on debt slaves and their elite masters, that of politicians creating entitlement cultures as each election expands the bribes politicians offer to get elected. Bribes that can only ever be paid for through debt and money printing that causes inflation, all the whilst vested interests and clueless academics and journalists who think they are clueless economists regurgitate the non existant deflation mantra, until the masses believe it must be so and why they miss WHOLE bull markets that the elite are LEVERAGED to.
Exponential Inflation Mega-trends
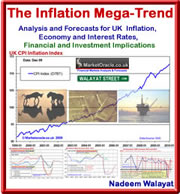
The following graphs of official CPI inflation rates (that tend to under report real inflation by between 1-1.5% per annum) illustrate the exponential inflation mega-trend's in motion that asset prices tend to be leveraged to and oscillate around and hence one of the primary mechanisms of how the elite accumulate wealth, whilst the effect on the wage slaves is to continuously lose purchasing power of net earnings (after taxes) thus forcing workers to take on debt and thus become reliant on political bribes (benefits and entitlements culture) and perpetual debt slaves who will spend virtually the whole of their adult lives servicing their debts, for instance over 90% of today's graduates will leave university with about £60,000 of debt that they will then be focused on servicing for the next 25 years of their lives.
See my latest ebook on how to escape debt slavery (FREE DOWNLOAD).
Housing Market Opportunities
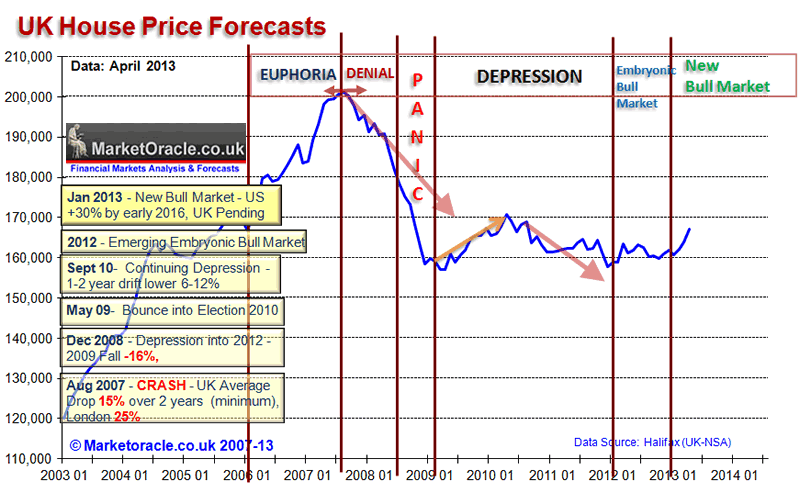
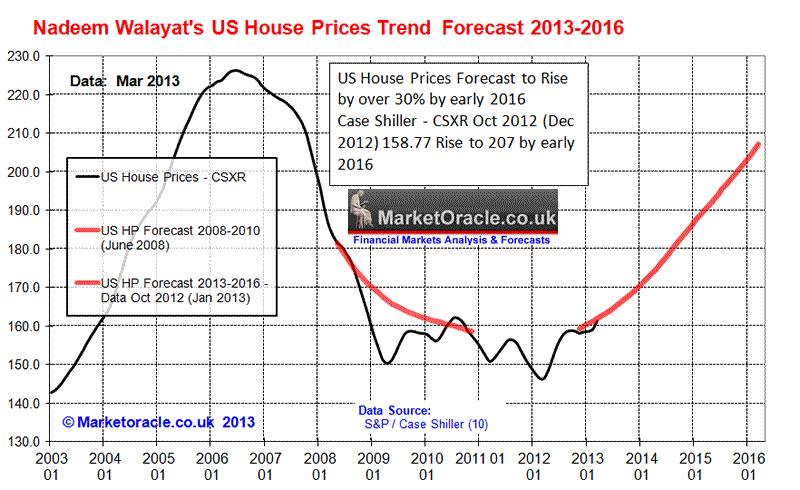
Meanwhile for well over a year now I have been flagging the much hated housing asset classes to focus on for the UK and US as presenting a once a decade opportunity as the embryonic bull market of 2012 HAS morphed into the new bull markets of 2013 that I expect will run for virtually the whole of the remainder of this decade, ensure you are subscribed to my always free newsletter to get my ongoing in-depth analysis in your email in box.
(12 Jan 2013 - U.S. Housing Real Estate Market House Prices Trend Forecast 2013 to 2016)
What I am Doing?
As a guide of what one could consider doing to protect themselves from the ongoing fraud and the outright risk of theft of bank deposits, the following updated table illustrates how my portfolio is trending in terms of asset classes to protect both against inflation stealth theft and possible outright theft.
| Jan 2012 | Mar 2013 | July 2013 | Dec 2013 | |
|---|---|---|---|---|
| UK Property | 0% |
50% |
60% |
61% |
| Cash & Bonds | 60% |
32% |
24% |
19% |
| Stocks & Commodities | 40% |
18% |
16% |
20% |
The bottom line is this just as the stocks bull market was a STEALTH bull market for many years, so will be the housing bull markets that many will BET against. The big picture implication is that we are also witnessing STEALTH economic recoveries in many countries that the clueless academic economists will fail to recognise for many more years as they remain fixated on non-existant deflation whilst the stealth bull markets rage on.
Source and Comments: http://www.marketoracle.co.uk/Article41365.html
Nadeem Walayat
Copyright © 2005-2013 Marketoracle.co.uk (Market Oracle Ltd). All rights reserved.
Nadeem Walayat has over 25 years experience of trading derivatives, portfolio management and analysing the financial markets, including one of few who both anticipated and Beat the 1987 Crash. Nadeem's forward looking analysis focuses on UK inflation, economy, interest rates and housing market. He is the author of four ebook's in the The Inflation Mega-Trend and Stocks Stealth Bull Market series.that can be downloaded for Free.
 Nadeem is the Editor of The Market Oracle, a FREE Daily Financial Markets Analysis & Forecasting online publication that presents in-depth analysis from over 600 experienced analysts on a range of views of the probable direction of the financial markets, thus enabling our readers to arrive at an informed opinion on future market direction. http://www.marketoracle.co.uk
Disclaimer: The above is a matter of opinion provided for general information purposes only and is not intended as investment advice. Information and analysis above are derived from sources and utilising methods believed to be reliable, but we cannot accept responsibility for any trading losses you may incur as a result of this analysis. Individuals should consult with their personal financial advisors before engaging in any trading activities.
Nadeem Walayat Archive |
© 2005-2022 http://www.MarketOracle.co.uk - The Market Oracle is a FREE Daily Financial Markets Analysis & Forecasting online publication.


