Stock Market (Bernanke) Demand Cannot be Sustained As Is
Stock-Markets / Stock Markets 2013 Jul 07, 2013 - 10:47 AM GMTBy: Michael_Noonan
 If central planners were put in charge of managing the Mohave Desert, out West, it would eventually run out of sand. When central planners manage anything, they distort natural market forces, and that ultimately creates an exaggerated effect in the opposite direction. At some point, and now sooner rather than later, the Fed's [Bernanke] interference with the stock market is going to make the 2008 crash seem like a minor correction.
There is one thing, and one thing only, driving the stock market, and that is debt. It is not new capital. It is not new investment in plants and machinery, the "old fashion" way of creating a sustained bull market. It is borrowed money, and the cost of cheap money is going to become dear. When that happens, the [overly] leverage factor is going to destroy everyone who is leveraged. This "party" to the upside will end, and when it does, those who chose to believe in the lies will suffer dire financial consequences.
Friday's "positive" jobs "growth" is a lie, plain and simple. More and more Americans are leaving the work force, [not by choice], joining those who have already left, but are considered "invisible" by the Bureau of Lies and Statistics. More and more Americans receive some form of welfare from the Federal teat...Food stamps, an example of the government's latest "growth industry." Full-time jobs are disappearing; part-time jobs ascending, mostly all minimum wage, offering no health care. "Thank you, Obamacare."
The government, on every level, is financial dead weight. Every cent spent by government comes from the public, and now, more so than ever, from deficit spending. Guess who is responsible for all deficit spending? Read the 14th Amendment. With almost zero rates of interest, Congress has zero reason to exercise fiscal "responsibility." They do not care.
Why mention all this? The charts are distorted, based on lies, just like those of gold and silver, where the COMEX has been used as a sledge-hammer against rising precious metal prices, the antithesis of fiat creation. The government hates anything that exposes its lies. Federal Reserve Notes are not dollars, not by law, and even according to their issuer, the Federal Reserve itself. Federal Reserve Notes, [FRN], are debt instruments.
Here is a shocker for everyone: Debt cannot be money, yet almost everyone treats it as though it were money, believing in the lie. When presented with the truth, it is not believed because it goes against the lie, which is believed as true. Do not take our word for it. DYODD. [Do your own due diligence]. Cognitive dissonance reigns.
We see the lies in the charts, and that is why the above lesson in reality was provided.
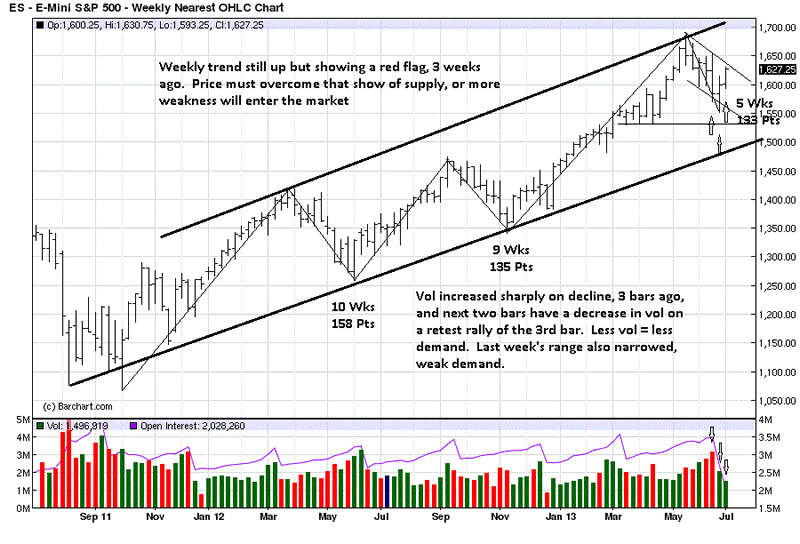
Mention has been previously made that volume has been greater on declines, an indication of increasing seller activity. The addition of the dark channel lines show the weekly chart to be stronger than expected. The last swing high reached the upper supply channel, and the swing low of two weeks ago stayed well above the lower demand channel line, and also above recent lows from March and April, all appearances of underlying strength.
The amount of time and price for the last swing lows are labeled. The current decline was similar in point value to the middle swing correction, but the decline accelerated in just half the time, an indication that sellers moved the market down with greater ease.
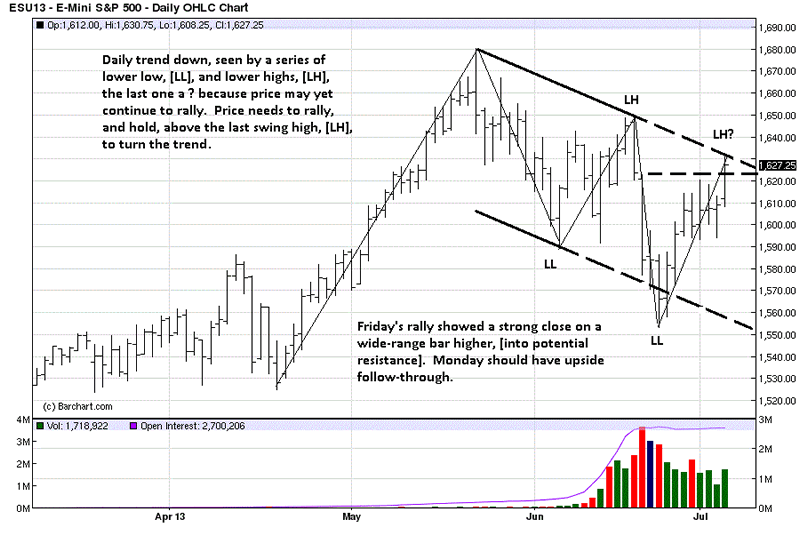
Price has rallied to the upper supply line of the down channel, seen in more detail on the daily chart. We get to see the how of price approaching a potential resistance area on both time frames when the market opens on Monday, [Sunday evening].

The LL and first LH are used to create the down channel. A line connects the high and the LH, extended lower into the future, the dashed portion, and a parallel line is drawn from the LL, extended into the future, also represented by the dash spaced portion. A new LL was formed at an oversold condition, and now price is retesting the upper channel.
The dashed horizontal line off the wide-range bar down, in mid-June, usually offers some resistance, just not in this case. The ease of upward movement from the correction low of Thursday and continuing in Friday's rally would suggest a higher price on Monday.

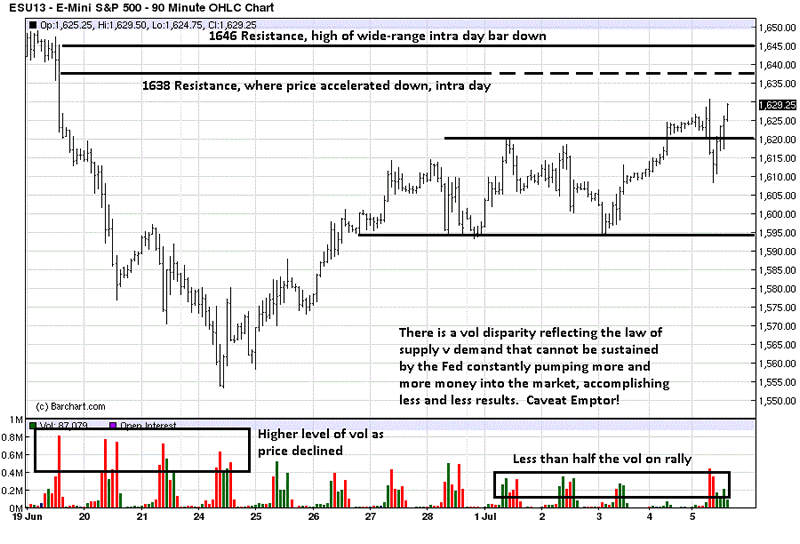
An intra day inspection of the wide-range bar from 19 June, on this 90 minute chart, tells us price accelerated lower starting at 1638, and it can act as resistance on a retest, if price does go higher on Monday. The high of the entire bar is labeled at 1646, just below the 1650 area swing high, and it, too, can be a potential resistance.
The volume on the left hand side of the chart, as price was declining, is about twice the volume on the right hand side, as price rallied. There has been ample evidence of this out of line supply v demand activity in the past. This happens to show the disparity quite clearly. It is why this commentary began with the editorial caveat. No market can ignore the basic laws of nature without eventually succumbing to natural order.
The lesser volume "demand" side comes from the Fed, injecting unlimited fiat into the market, overwhelming the natural inclination to sell. The forces of supply and demand remain distorted. Central planners can keep it that way longer than rational opposing forces can remain solvent, so sellers simply stay out of the way. They will have their day.
Monday's activity can be telling for the immediate term as price goes into the obvious resistance areas, as shown on all three time frames. The daily and intra day time frames have been down, and a few attempts were made from the short side, resulting in small losses.
If price weakens against support, expect a reversal to the downside. If price stays around the resistance area, its ability to hold is the market's way of telling us buys are absorbing the sellers, and price will continue higher. Plan accordingly.

By Michael Noonan
Michael Noonan, mn@edgetraderplus.com, is a Chicago-based trader with over 30 years in the business. His sole approach to analysis is derived from developing market pattern behavior, found in the form of Price, Volume, and Time, and it is generated from the best source possible, the market itself.
© 2013 Copyright Michael Noonan - All Rights Reserved Disclaimer: The above is a matter of opinion provided for general information purposes only and is not intended as investment advice. Information and analysis above are derived from sources and utilising methods believed to be reliable, but we cannot accept responsibility for any losses you may incur as a result of this analysis. Individuals should consult with their personal financial advisors.
Michael Noonan Archive |
© 2005-2022 http://www.MarketOracle.co.uk - The Market Oracle is a FREE Daily Financial Markets Analysis & Forecasting online publication.


