


The 3 Essential Parts of an Elliott Wave Trade - Visual Guide to Elliott Wave Trading
InvestorEducation / Elliott Wave Theory Jul 06, 2013 - 11:02 AM GMTBy: EWI

 A NEW series of educational trading lessons from "Visual Guide to Elliott Wave Trading" -- Part 1 of 3
When it comes to improving your wave-based analysis and technical trades, three steps may sound simple enough. Yet if you have any experience trading, you know that nothing about trading is easy.
Senior Analyst Jeffrey Kennedy knows that it takes skill, discipline and courage to execute a successful trade. In the new book he has coauthored with EWI's Wayne Gorman (now a No.1 Amazon Bestseller), Visual Guide to Elliott Wave Trading, he picks up where Frost and Prechter's classic textbook Elliott Wave Principle leaves off to give you the perfect blend of traditional textbook analysis and real-world application.
According to Kennedy, there are three key components of a successful trade:
- Analyze the price charts.
- Formulate a trading plan.
- Manage the trade.
In this excerpt (Part 1 of 3), Kennedy examines a high-confidence trade setup in Caterpillar (CAT).
Part One: Analyze the Price Charts
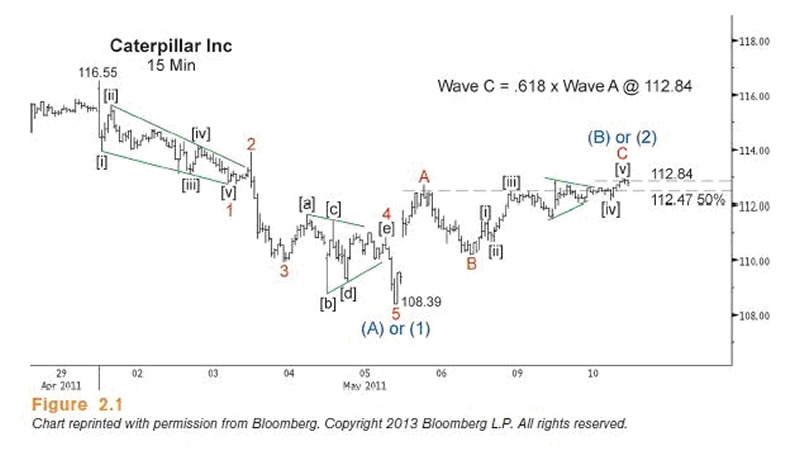
When it comes to trade setups, it doesn't get much easier than the price chart of CAT from April and May 2011. As you can see in Figure 2.1, prices fell in five waves from 116.55 to 108.39. This wave pattern was significant because impulse waves identify the direction of the larger trend. Thus, this five-wave decline in CAT implied further selling to come that would take prices below 108.39 in either wave (C) or wave (3).
The subsequent rally in CAT that developed in three waves supported this analysis. Countertrend price action typically consists of three waves, so I knew to expect another move down in CAT. Moreover, the three-wave advance in CAT traveled to 112.47 to retrace 50 percent of the previous sell-off. That 50 percent is a common retracement for corrective waves. Also nearby was 112.84, the price level at which wave C equaled a .618 multiple of wave A, which is a common Fibonacci relationship between waves C and A of corrective wave patterns.
The only question at this point was whether the move up from 108.39 should be labeled as wave (B) or wave (2). From a short-term trading perspective, this question was academic because, either way, the trade objective was a price move just under 108.39. A final observation about the corrective rally: The slope of wave C in this case was shallower than the slope of wave A. A shallow wave C slope, which demonstrates a decrease in momentum, is a harbinger that the larger trend is resuming. These shallower slopes within zigzags are so common that they are almost a qualifying characteristic of the pattern.
By applying the most basic Elliott wave analysis to the price chart of CAT, I could see five waves down and three waves up into Fibonacci and structural resistance at 112.47-112.84. That meant that odds strongly favored a sell-off below 108.39 from near current levels. So, the question at that point was how best to capitalize on this information.
Stay tuned for parts 2 and 3 of this lesson.
|
The Ultimate Wave Trading Crash Course Put yourself on the fast track to applying the Elliott Wave Principle successfully with a FREE one-week primer: The Ultimate Wave Trading Crash Course. Learn the basics with 5 FREE trading lessons from EWI Trading Instructor and Senior Analyst Jeffrey Kennedy -- including insightful excerpts from his Amazon No. 1 Bestseller, Visual Guide to Elliott Wave Trading. |

This article was syndicated by Elliott Wave International and was originally published under the headline The 3 Essential Parts of an Elliott Wave Trade . EWI is the world's largest market forecasting firm. Its staff of full-time analysts led by Chartered Market Technician Robert Prechter provides 24-hour-a-day market analysis to institutional and private investors around the world.
About the Publisher, Elliott Wave International
Founded in 1979 by Robert R. Prechter Jr., Elliott Wave International (EWI) is the world's largest market forecasting firm. Its staff of full-time analysts provides 24-hour-a-day market analysis to institutional and private investors around the world.
© 2005-2022 http://www.MarketOracle.co.uk - The Market Oracle is a FREE Daily Financial Markets Analysis & Forecasting online publication.