


The Stock Bull Market Top
Stock-Markets / Stock Markets 2013 Jul 03, 2013 - 06:29 AM GMTBy: Ed_Carlson
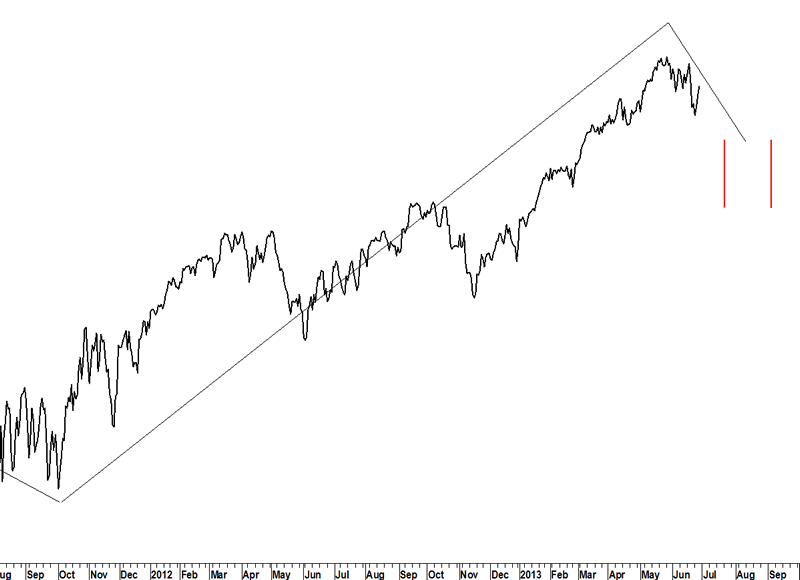
 It looks increasingly likely that the high in the Dow on 5/22/13 was the top of the bull market. Let’s go through the process used by George Lindsay to discover why.
It is true that the window for the top (as defined by the 15year interval from October 1997) is open until the end of September, as is the time span of a short basic advance (630-718 days) from the low of the basic cycle on 10/4/11.
A final high on 5/22/13 would make the basic advance 596 calendar days. This count fits the time span of a sub-normal basic advance (414-615) but the occurrence of sub-normal advances has been very rare.
A Middle Section count, taken from the major cycle, points to a high within five days of the May top.
All the above (by itself) does not rule out the possibility of a higher high before the end of September. The likely elimination of any higher high during that time frame is inferred from the following observations.
The next Middle Section forecast for a high comes on 7/5/13. A top then would make the basic advance 640 days and fit the time span of a short basic advance (630-718 days). Despite new-month bullish seasonality, it seems unlikely that the Dow can gain enough in the next two trading days to see a new high. Of course, it is possible…
The bigger challenge is the existence of a 12year interval which points to a tradable low (not bear market low) between 7/21/13 and 9/4/13. The 12year interval should be expected to pull the Dow down into a low sometime during this period.
If a new high is not printed in the days surrounding 7/5/13, and a decline is seen into the late July/ early September time frame, that leaves only three weeks before the window closes for a final high to the bull market in the Dow. It wouldn’t be unusual to see the 12year interval expand to include most of September, and not just the first four days. Given September’s track record, an advance during this time of year seems unlikely.
Discover more of the work of George Lindsay at Seattle Technical Advisors.com
Ed Carlson, author of George Lindsay and the Art of Technical Analysis, and his new book, George Lindsay's An Aid to Timing is an independent trader, consultant, and Chartered Market Technician (CMT) based in Seattle. Carlson manages the website Seattle Technical Advisors.com, where he publishes daily and weekly commentary. He spent twenty years as a stockbroker and holds an M.B.A. from Wichita State University.© 2013 Copyright Ed Carlson - All Rights Reserved
Disclaimer: The above is a matter of opinion provided for general information purposes only and is not intended as investment advice. Information and analysis above are derived from sources and utilising methods believed to be reliable, but we cannot accept responsibility for any losses you may incur as a result of this analysis. Individuals should consult with their personal financial advisors.
© 2005-2022 http://www.MarketOracle.co.uk - The Market Oracle is a FREE Daily Financial Markets Analysis & Forecasting online publication.