


FTSE Stock Index Make Or Break Time On Next Rally
Stock-Markets / Stock Markets 2013 Jul 01, 2013 - 06:07 AM GMTBy: Michael_Noonan

 Put all news and opinions aside. The best and most reliable source for market information comes directly from the market itself, the clearinghouse for all of the decisions that are executed in the marketplace. It is actual executions that matter the most.
Our primary focus for stocks is the S&P, being Chicago-based, but a chart is a chart by any other name, and the FTSE dances to the same beat of supply and demand, as all markets ultimately do. Here is what the market has to say, based upon collective input from all sources, from the best and most informed to the least and uncertain.
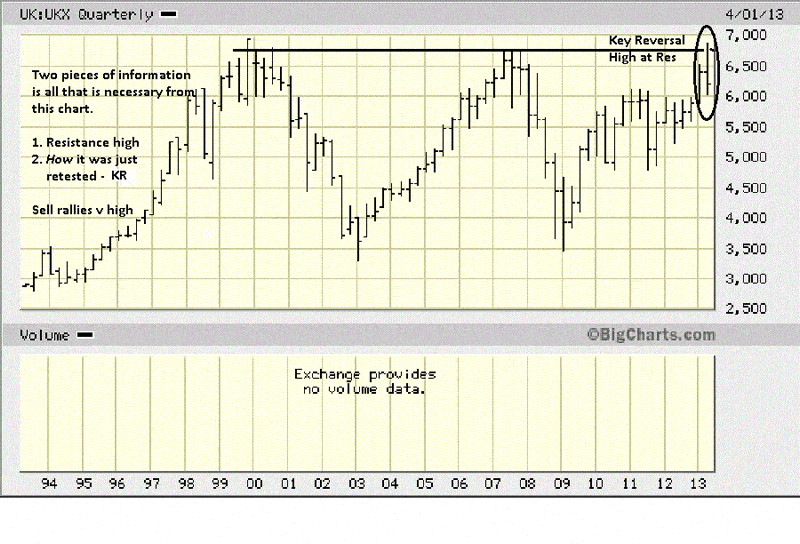
The 2nd Qtr just ended, so we start there. Plus, it is an easy chart to do because there are only two important pieces of information that recently converged before diverging. The dark horizontal line crosses two previous highs, and the last Qtr just retested resistance.
What is key on any retest is how price responds or reacts to it. The response was quite clear: a Key Reversal, [KR]. This occurs when price makes a higher high, closes low-end, and under the previous bar's close, as in this instance, [there are other variations]. It almost always signals a top, of some degree.
The level of synergy from one time frame to lower time frames becomes important when they validate each other. To the monthly...
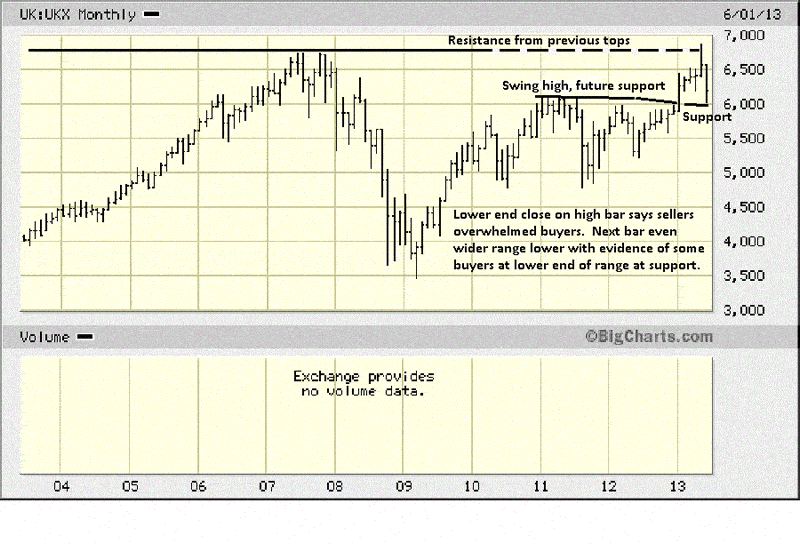
A KR or not a KR high? Labels are less important than the actual market activity being considered. We see another retest of previous highs, and the response is a reaction away from the high. There was no attempt to absorb sellers before going higher, as would be expected in an uptrend. Instead, the lower close is the market telling us that sellers were more dominant than buyers, and at an area where buyers are supposed to be in control. This is a red flag bar.
On the next bar, June, the range is wider and to the downside, also with a weak close. The sellers that appeared in May are pressing their cause, and doing it successfully, as was forewarned. The low of the bar stopped just above the round number 6,000, which is also now potential support from the last swing high.
Note how the resistance line, on top of the swing highs, is not a straight line but more of a meandering line that more accurately reflects the market activity. January's bar was a breakout rally, 6th bar from the right, with a wide range up and a relatively strong close.
That strong bar can act as support on a retest, so you can see how market activity from the swing highs and the strong rally bar advertised a likely support area months before it was retested, just last month. The issue with the retest is how price declined so quickly going into potential support. The month of June erased 4 previous rally bars, prior to May.
The warning from the Qtrly chart is showing more detail in support of it on the monthly.
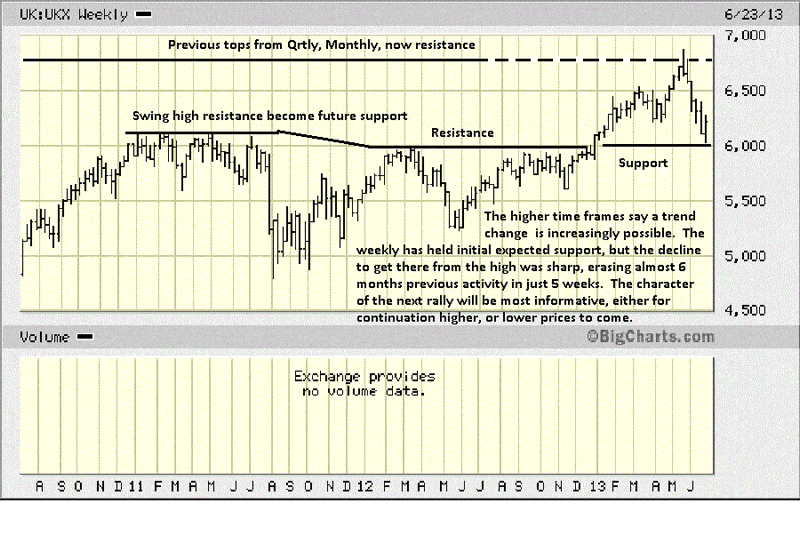
The weekly amplifies the monthly with even greater detail. Compare the 6 bar decline with the more labored rally to high that began in January. The ranges down are much larger than the rally bars. The ease of movement is clearly to the downside, and that means the sellers are more in control.
On the Qrtly chart, we added the comment to sell rallies against the high, based on the KR formation and poor close. The character of how the next rally unfolds, will be the market's message of what to expect moving forward. If the rally bars are relatively smaller with few strong closes, and volume declines, expect more weakness to follow.
Ignore the news. Too many people read the news or listen to highly biased media talking heads that want to cheer prices higher. The market will be providing the best ringside seat with the most current price information you will find anywhere. It is available to anyone and everyone at the same time to read. Its message is the most accurate of all.
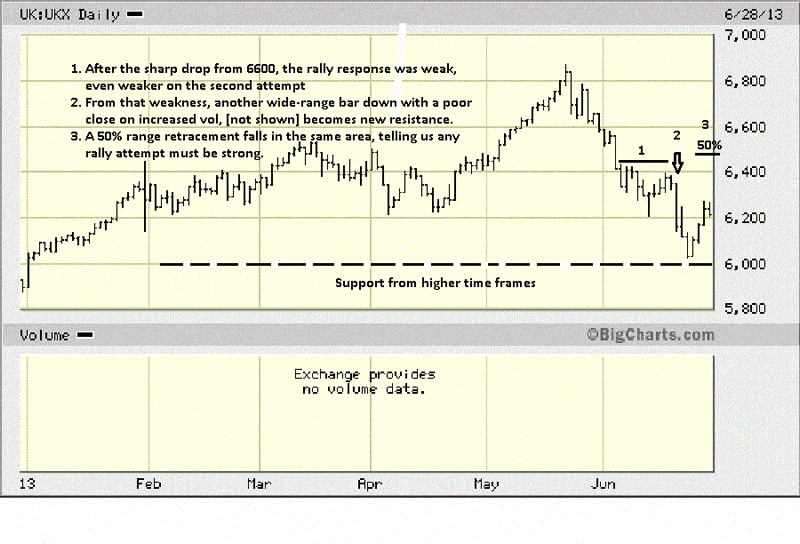
There is an improved close on the last bar of the week, and it suggests a rally of some sort going into July. We do not know if a rally will occur, but it is not necessary to know. All we have to do is follow the developing market activity flow, letting the market lead, and then simply follow along.
None of these 3 time frames are used for timing entry and/or exit for trading. The daily is more suited for that purpose.
There were ample signs to no longer be long this market, but that is past tense, and what matters most is what to do moving forward. The three higher time frames just reviewed all say the trend has weakened. The daily trend has already turned down, by virtue of lower highs and lower lows.
As trend followers, one does not want to be long in a downtrend. The market structure has provided a roadmap of what may happen next. Now we enter the realm of "If, Then." IF we see a weak rally into the area shown on the chart: the 50% range resistance, the failed rally at 1., the wide-range ease of movement down bar at 2, THEN we know the odds favor going short, with an edge.
There is no guesswork, no predicting, no shooting from the hip, as it were. Instead, we have the factual underpinning of market activity as a guide. It is the character of the next rally that will confirm the edge to go short, and IF it does not, THEN there is no trade to be made.
Using the factual character of past market activity, and measuring it as present tense market activity develops eliminates having to know the future. We get to deal with what IS known, and it applied well, the future will take care of itself.
The money is made before the trade is even made. now you know why.
By Michael Noonan
Michael Noonan, mn@edgetraderplus.com, is a Chicago-based trader with over 30 years in the business. His sole approach to analysis is derived from developing market pattern behavior, found in the form of Price, Volume, and Time, and it is generated from the best source possible, the market itself.
© 2013 Copyright Michael Noonan - All Rights Reserved Disclaimer: The above is a matter of opinion provided for general information purposes only and is not intended as investment advice. Information and analysis above are derived from sources and utilising methods believed to be reliable, but we cannot accept responsibility for any losses you may incur as a result of this analysis. Individuals should consult with their personal financial advisors.
Michael Noonan Archive |
© 2005-2022 http://www.MarketOracle.co.uk - The Market Oracle is a FREE Daily Financial Markets Analysis & Forecasting online publication.