


Stock Market Downtrend May Have Bottomed
Stock-Markets / Stock Markets 2013 Jun 22, 2013 - 04:11 PM GMTBy: Tony_Caldaro

 An interesting week. The market started the week by gapping up and rallying to SPX 1654 just before the close on Tuesday. Wednesday, FOMC day, the market hovered just below that level awaiting the FOMC statement and press conference. When traders heard about a potential cut back in QE 3 by year end, and concluding it by mid-2014, the May-June correction resumed. For the week the SPX/DOW were -1.95%, the NDX/NAZ were -2.05%, and the DJ World index lost 3.2%. Economic reports for the week remained positive. On the uptick: the NY/Philly FED, the NAHB, the CPI, housing starts, existing home sales and leading indicators. On the downtick: building permits, the M1 multiplier, the WLEI plus weekly jobless claims rose. Next week we get Q1 GDP, personal income/spending and PCE prices.
LONG TERM: bull market
The Cycle wave [1] bull market from March 2009 continues. During this five Primary wave bull market we have seen Primary waves I and II conclude in 2011, with Primary III underway since then. Primary I divided into five Major waves with a subdividing Major wave 1. Primary III is also dividing into five Major waves, but both Major waves 1 and 3 are subdividing. Major waves 1 and 2 of Primary III completed by mid-2012, Major wave 3 has been underway since then. Intermediate waves i and ii of Major 3 completed by late-2012.
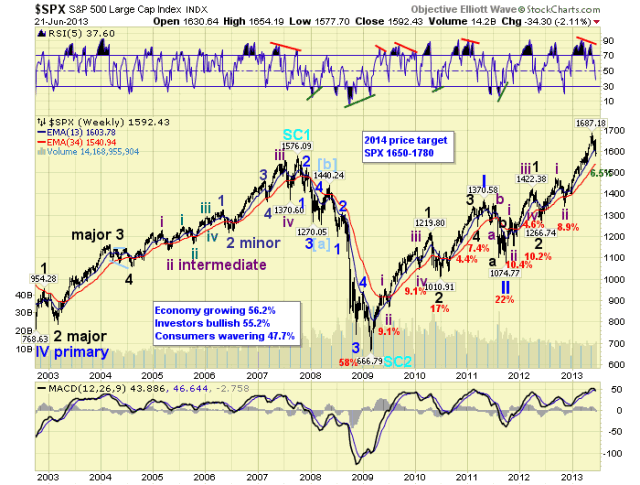
Intermediate wave iii probably completed in May13 and Intermediate wave iv has been underway since then. When Int. iv concludes an uptrending Int. v should take the market to all time new highs to complete Major wave 3. Then after a Major 4 correction, a Major 5 uptrend to new highs should complete Primary III. Finally, after a Primary IV correction an uptrending Primary V should complete the bull market. So we still have three more uptrends, separated by downtrends, before the bull market concludes. We are still expecting a final top in late-winter to early-spring 2014.
MEDIUM TERM: downtrend probable
Despite the correctional activity for the past four weeks we still have not received a downtrend confirmation from OEW analysis. This is a bit unusual since 95% of the International markets we track are in confirmed downtrends, with the US the only exception. We do expect it to occur this week. Nevertheless we have been tracking the market like it has been in a correction since the SPX 1687 high on May 22nd. This week the market made a new low for Intermediate wave iv at SPX 1578. Thus far, the market has corrected 6.5%.
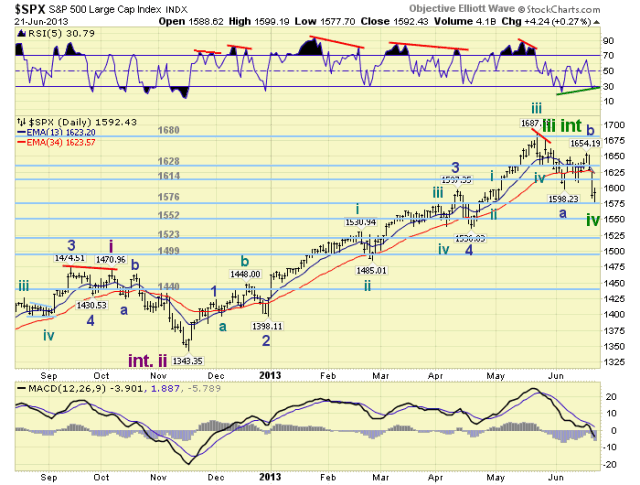
We have been counting the correction as a complex three. From the orthodox high of Int. iii at SPX 1674 we observed a double zigzag into the early June 1598 low, and labeled that Minor wave a. Early this week Minor b completed, with its own zigzag, at SPX 1654. After that the market went into free fall hitting a low of SPX 1578 on Friday it what appears to be a double zigzag of its own. At that low Minor c (1654-1578) equaled Minor a (1674-1598). Setting up for a potential Int. iv low.
The market did react off that low with three waves SPX: 1595-1585-1598 thus far. This advance represents the best rally since Minor c began. The previous rallies were between 9 and 15 points. At the low we had a positive divergence on the hourly RSI, from the most oversold level since Intermediate wave ii, and the most oversold MACD since November 2011. The market is also displaying a positive RSI divergence on the daily chart, and a sufficiently oversold RSI on the weekly chart. As a result of all these technical parameters we posted a tentative Int. wave iv low label at SPX 1578. Since the counter rallies during Minor a only lasted a day or two. We should know if the bottom is in by early next week. Medium term support is at the 1576 and 1552 pivots, with resistance at the 1614 and 1628 pivots.
SHORT TERM
Short term support is at the 1576 and 1552 pivots, with resistance at SPX 1593-1599 and the 1614 pivot. Short term momentum neared neutral after Friday’s positive divergence. The short term OEW charts remains negative with the reversal level now at SPX 1621.
We have been expecting an Int. wave iv correction to last into June ending between the OEW 1523 and 1552 pivots. There are a series of 4th waves from the Int. iii uptrend between SPX 1536-1540. We identified Minor wave a as a double zigzag (1674-1598), and have been expecting a double zigzag for Minor wave c as well. The recent decline from SPX 1654-1578 may have met that parameter, as it was seven waves: 1642-1651-1599-1609-1584-1599-1578. Friday’s rally off that low was encouraging: 1595-1585-1598.
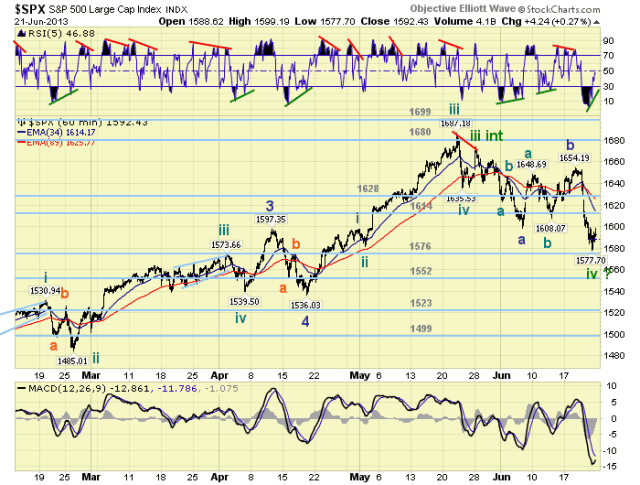
While a correction low does look possible. We would still like to see the market rally above the OEW 1614 pivot. If this rally can not clear this level then it is probably a Minute wave b of Minor c, with a declining Minute wave c to follow. That would suggest another decline into the 1523 to 1552 pivot zone, specifically around SPX 1536-1540. This count is posted on the DOW hourly chart as an alternate. We shall see soon enough. Best to your trading!
FOREIGN MARKETS
The Asian markets were mostly lower on the week for a net loss of 2.2%. All eight indices are in confirmed downtrends.
The European markets were all lower on the week for a net loss of 4.8%. All eight indices are also in confirmed downtrends.
The Commodity equity group were all lower for a net loss of 3.2%. All three indices are in confirmed downtrends. Ninety-five percent of the International indices we track are in confirmed downtrends.
The DJ World index is downtrending and lost 3.2%.
COMMODITIES
Bonds had one of their worse weeks in many years losing 2.7%. Bonds are not only downtrending, but are officially in a bear market.
Crude continues to be choppy and volatile, still uptrending but lost 3.9% on the week.
Gold’s choppy uptrend turned into another downtrend as it lost 6.6% on the week. The spring swoon has apparently stretched into the first day of summer.
The USD has been downtrending, but may have reversed. It gained 2.4% on the week.
NEXT WEEK
Tuesday kicks off the economic week with: Durable goods, Case-Shiller, FHFA housing index, Consumer confidence and New home sales. Wednesday: Q1 GDP (est. +2.4%). Thursday: weekly Jobless claims, Personal income/spending, PCE prices and Pending home sales. Friday: the Chicago PMI and Consumer sentiment. The FED has three public activities scheduled. Tuesday: Director Vermilyea testifies before the senate. Thursday: FED governor Powell gives a speech in Wash, DC. Friday: FED governor Stein gives a speech at the CFR … interesting. Best to your weekend and week!
CHARTS: http://stockcharts.com/...
http://caldaroew.spaces.live.com
After about 40 years of investing in the markets one learns that the markets are constantly changing, not only in price, but in what drives the markets. In the 1960s, the Nifty Fifty were the leaders of the stock market. In the 1970s, stock selection using Technical Analysis was important, as the market stayed with a trading range for the entire decade. In the 1980s, the market finally broke out of it doldrums, as the DOW broke through 1100 in 1982, and launched the greatest bull market on record.
Sharing is an important aspect of a life. Over 100 people have joined our group, from all walks of life, covering twenty three countries across the globe. It's been the most fun I have ever had in the market. Sharing uncommon knowledge, with investors. In hope of aiding them in finding their financial independence.
Copyright © 2013 Tony Caldaro - All Rights Reserved Disclaimer: The above is a matter of opinion provided for general information purposes only and is not intended as investment advice. Information and analysis above are derived from sources and utilising methods believed to be reliable, but we cannot accept responsibility for any losses you may incur as a result of this analysis. Individuals should consult with their personal financial advisors.
Tony Caldaro Archive |
© 2005-2022 http://www.MarketOracle.co.uk - The Market Oracle is a FREE Daily Financial Markets Analysis & Forecasting online publication.