Media, Economy and Markets Behind The looking Glass!
Stock-Markets / Financial Markets 2013 Jun 16, 2013 - 12:46 PM GMT The most important service rendered by the press and the magazines is that of educating people to approach printed matter with distrust! - Samuel Butler (1612 – 1680)
I have been of the opinion for a number of years that what we see in the media is exactly what “they” want us to see, no more and no less. With very few exceptions, if we see it on TV it’s because they want us to see it and it is meaningless. If by chance you do see something bad on TV it’s because it isn’t what it appears, or the censors slipped up. Most of what appears to be bad is simple misdirection intended to distract your attention away from what really matters. This week was no exception as we are subjected to the monotonous drone of employment numbers, earnings reports and whether or not the market has topped. None of that matters, at least not in the way it is being presented to us.
So what are we missing when we listen to Bloomberg? On Friday the city of Detroit said it would default on a payment due to creditors due that same day, setting the stage for last-ditch talks to avert the largest municipal bankruptcy in US history and push through a financial restructuring plan that would cut benefits to workers and payments to some bondholders. Kevyn Orr, the emergency manager appointed by the State in March to lead the city out from under its estimated $17 billion in long-term liabilities, invited creditors to Detroit to unveil his 128-page presentation. In the plan Mr. Orr deemed Detroit “insolvent”, and called for “shared sacrifices” to save it from bankruptcy.
According to Mr. Orr “financial mismanagement, a shrinking population, a dwindling tax base and other factors over the past 45 years have brought Detroit to the brink of financial and operational ruin.” He went on to say the city would not pay the $39.7m due on Friday to holders of pension-related certificates of participation. These were among the bonds downgraded on Thursday by Moody’s, which gave them a credit rating of Caa3, the agency’s third-lowest rating. Caa3 means the agency views the bonds as being of poor standing and subject to very high credit risk. Mr. Orr also proposed issuing $2bn in notes to pay unsecured creditors on a pro-rated basis, as well as cuts to city worker and retiree healthcare and pension benefits. The plan would also include an oversight board to ensure reforms are enacted and sustained, and $1.25bn to restore services and repair the city.
More than one hundred participants, including insurers, bondholders, unions and swap counterparties, will weigh the offer. Initial discussions are scheduled to start on Monday. Mr. Orr has previously taken a hard line with creditors and last Monday he said at a public meeting the city faced a 50-50 chance of Chapter 9 bankruptcy. If such a step were taken, the claims of bondholders and workers are treated equally. Detroit isn’t the only city suffering these days as Philadelphia, Cleveland and a host of others spread across the rust belt are feeling the effects of decades of globalization, i.e. the shifting its core manufacturing jobs overseas and the shrinking of its population and tax base. In Detroit’s case the population fell from 1.8m in 1950 to 700,000 today. The city has an accumulated budget deficit of $375m.
In March, Dan Snyder, governor of Michigan, took the unusual step of declaring Detroit in a state of fiscal emergency and appointed Mr. Orr, a restructuring specialist with the law firm Jones Day, to manage its finances. The appointment gives him broad powers to bypass the City Council – which had gone to court to block his appointment – to void collective bargaining agreements and to declare bankruptcy. There are limits though as he had suggested he was considering selling parts of the multibillion-dollar Detroit Institute of Arts collection to cover a portion of the debt, though the state senate later voted to prohibit the move. In a note accompanying its downgrade on Thursday, Moody’s cited the growing likelihood of a bankruptcy filing or a major debt restructuring. The one-notch rating cut pushes the bonds deeper into Moody’s “highly speculative” category. “Should default or bankruptcy occur, the recovery levels for bondholders could potentially be quite low based on recent municipal recovery rates for other distressed local governments,” Moody’s analyst Genevieve Nolan wrote.
Debt at the city, municipal and State level is staggering and yet we almost never hear anything about it. As these governments cut back more people become unemployed, lose their homes, their benefits and their pensions. I can understand losing your job and even your benefits, but how do you lose your pension when both you and the entity you work for have made payments into it for years? If you manage a small company and fail to keep up with your workers pension contributions, you’ll go to jail. Yet State and local governments around the country have mismanaged hundreds of billions of dollars of your money and it doesn’t even rate a discussion. If by some odd miracle the topic does see the light of day, commissions are appointed and manned by individuals friendly to the thieves.
There is an old saying that a country is only as sound as its currency, so with that in mind I want to take a look at the plight of the US dollar. We’ll begin by looking at an historical monthly chart of the US dollar:
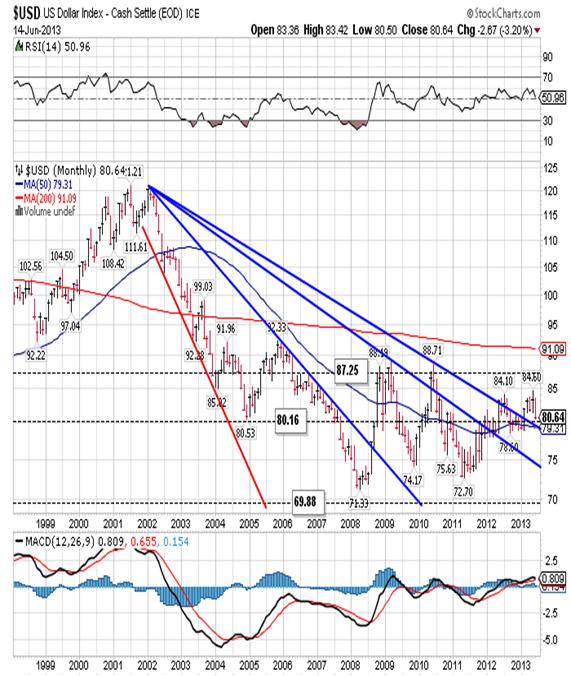
You can see the initial thrust down beginning in 2002 and bottoming in 2008. Everything since then has been sideways movement highlighted by a series of lower highs that imply distribution.
In 2011 the greenback put in a higher low and has been on the rise ever since as you can see below:
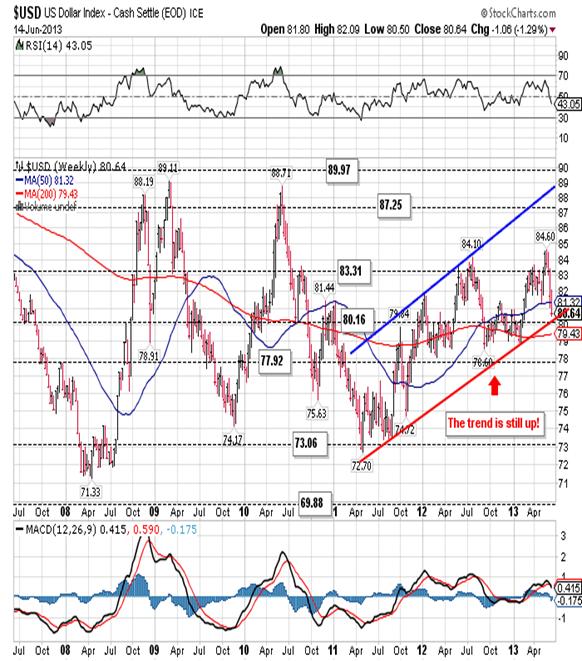
This prompted a number of analysts to pontificate that the dollar had in fact entered a new bull market. Actually nothing could be further from the truth. The reality is that the two major competitors to the US dollar, the Euro:
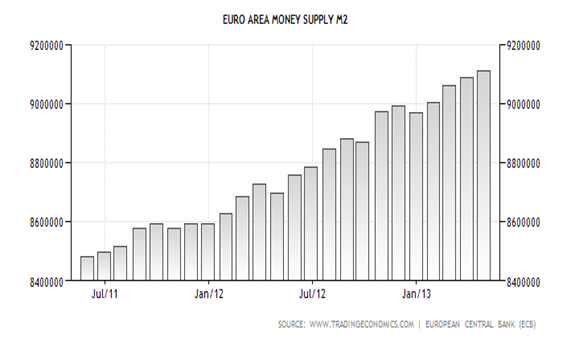
and the Japanese Yen:
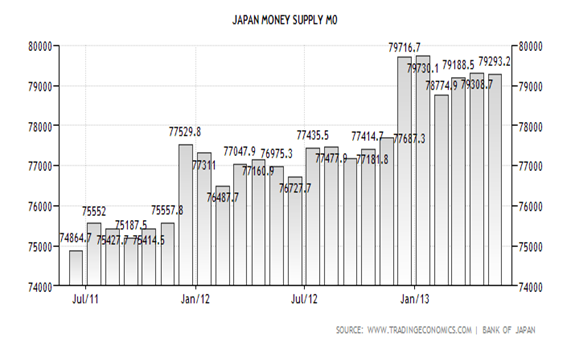
all began to print excessively back in 2011 in an effort to counteract the effects of a “cheap dollar”. This race to the bottom to see who can have the cheapest currency had two effects:
- Comparatively it made the US dollar look like it was the lesser of all evils giving it a new lease on life, and
- It flooded the world with debt, so much so that it crowded out growth.
The second point is of extreme importance as the need to service more and more debt is affecting growth around the world. The growth rate for the planet in 2010 was 5.1% and it is now estimated that it will fall below 3% in 2013.
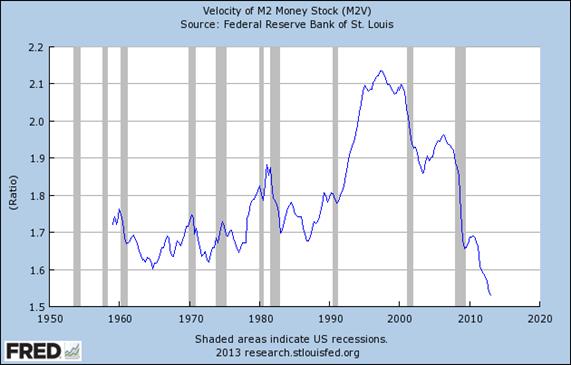
In particular this idea that quantitative easing, in essence uncontrolled printing of fiat currency, will lead to growth and inflation is a fallacy. The velocity of money, the speed with which a dollar moves through the economy, has reached an all-time low as you can see here:
This is a clear indication that the ‘money’ being printed does not make it into the hands of the general public, and that’s why the US economy is stagnating.
With respect to debt the bond market continues to head in the wrong direction, at least as far as the US Federal Reserve is concerned:
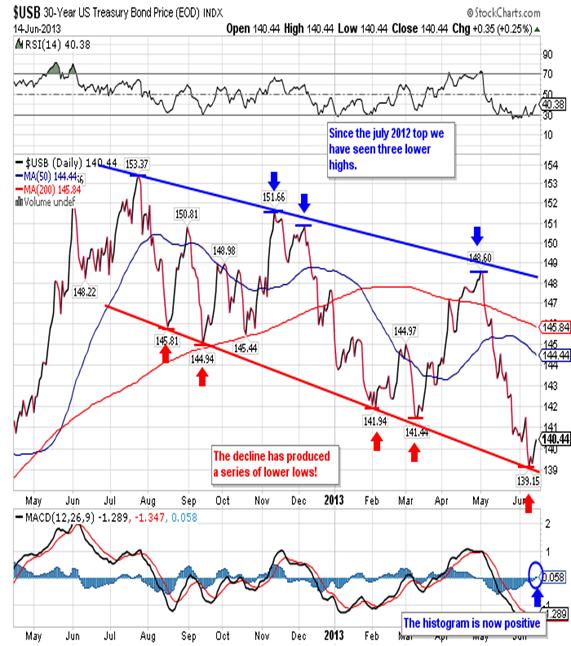
In spite of all the Fed guarantees to the contrary you can see that bond prices have been heading lower for almost a year and that mean interest rates have been moving higher. I should add that is the wrong policy mix for a stagnating economy!
With respect to the immediate future we saw the bonds trade to a new lower low of 139.15 and in the process have retraced close to 70% of the last leg up in the bond bull market:
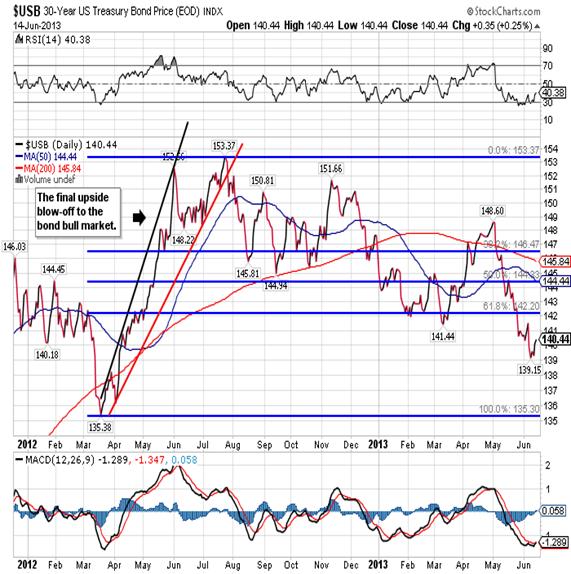
That low came on Monday and since then the bond has begun to work its way higher. They closed out the week at 140.44 and I am looking for a move back up to the 142.20 area before it turns lower to test the 2012 low of 135.38. I continue to believe that the bull market is over and bonds will work their way to much lower levels over time. My down side target for 2013 is no less than 128.00 and it could fall as low as 124.00. Bonds are a great short sale!
Stocks are another question altogether. The Dow’s all-time closing high of 15409 came back on May 28th and it’s been
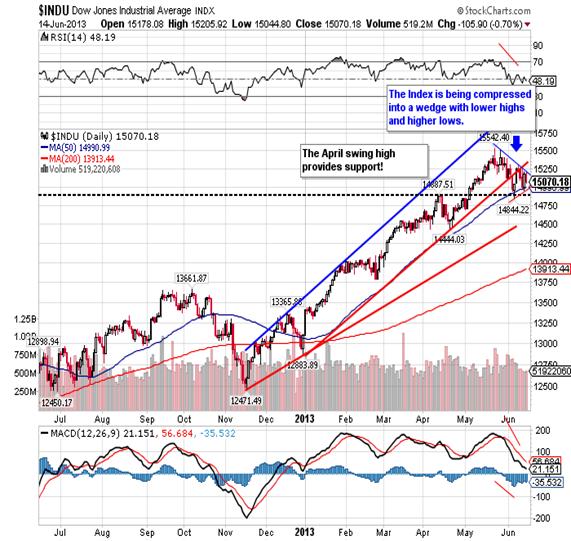
followed by a sideways movement within a shrinking trading range. Support is found at the April swing high of 14,887. You can also see that the Index has fallen below the bottom band of this year’s trading range and the big question is whether or not this is all part of a topping process? In an effort to find clarity we can look at the Transportation Index:

Unfortunately, all we see here is more weakness and an index that has already violated its respective swing high from back in March. What’s more the Transports did not confirm the May 28th all-time high in the Dow.
Rather than focus on the Dow itself, I would watch the NYSE Advance-Decline Index, a cumulative measure of net advances, much like you would watch for irregularities in the heartbeat of an individual:
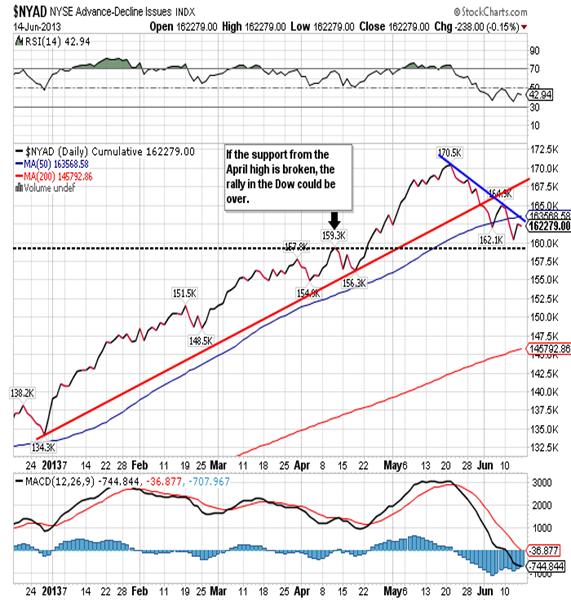
We can see that the Index topped in May about one week before the Dow and has since broken support. I would watch it carefully to see if it can confirm a new high in the Dow, or inversely it moves below its April high.
In conclusion, I don’t know which way the Dow is going form here and that’s always a good reason for not investing in something. Perhaps the best reason for avoiding stocks has to do with the complete absence of value. Right now the Price/Earning Ratio for the S & P 500 stands at 20.65 while the average dividend yield 1.97%. These are extreme readings that you normally find at the end of a bull market and not at the beginning. How can that be? By deciding to intervene in the markets, the Federal Reserve never allowed the bear to fully express itself to the point where the PER and average yield both registered a six (or there about) so now we have a real dilemma. The Fed has created trillions in new debt in order to prevent the inevitable, and now the economy is stagnating and debt is absorbing liquidity faster than the Fed can print. That is a recipe for disaster and the best reason in the world to avoid stocks at this point in time.
That leaves us with gold. I normally begin this discussion with the yellow metal itself, but this time I want to begin with a discussion of gold stocks. In particular I want to take a look at the Philadelphia Gold & Silver Index, also known as the XAU:
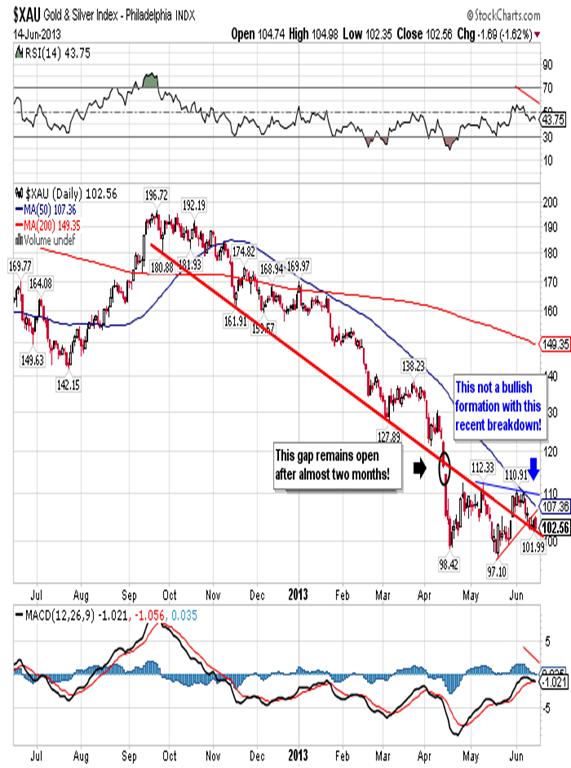
I believe that any rally in gold will start first in the gold stocks, and yet this chart is a disaster. The 50-dma is trading well below the 200-dma and both are pointed downward. Recently the Index broke down from a wedge formation and on Friday is closed right on the bottom band of a trend line that goes back to October of last year. Finally, we saw the price of physical gold rally on Wednesday and Friday and yet the XAU couldn’t advance. I know that clients are chafing at the bit wanting to buy what they believe are cheap stocks, but this chart is telling us they’ll be even cheaper in a couple of weeks so I would keep your powder dry.
Physical gold is more of the same story in my opinion even
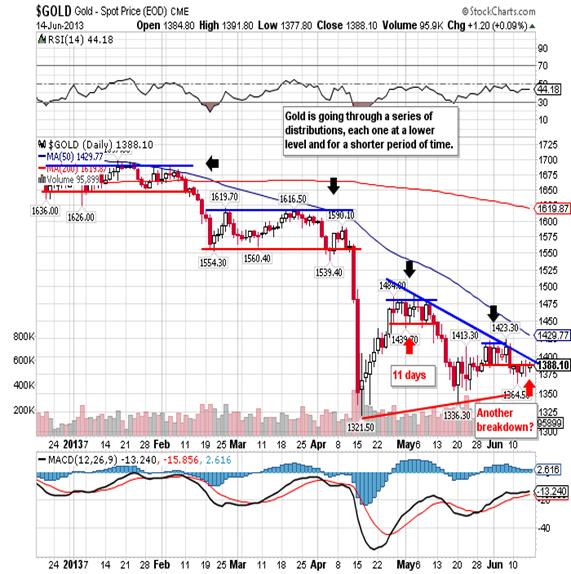
though that’s not what clients want to hear right now. There is a real shortage of patience out there as investors want to do “something” even if it’s not the right thing or the right time. That usually doesn’t end well. The previous chart shows a continuation of the series of breakdowns that we’ve been experiencing for months.
I remain extremely bullish gold over the long run but I still have to recognize that the secondary and tertiary trends are headed lower for the time being. So it doesn’t matter how much you may like gold, you’re still going to have to be patient for a while longer. I continue to look for a test of the April 16th low of 1,321.50 and lower lows beyond that, maybe even all the way down to 1,087.00. More than the decline in the price itself, you need to think about the significance of such a drop. When gold rises everyone attributes it to strong inflationary pressures, so when gold declines consistently over time you must attribute it to strong deflationary pressures. In a world drowning in debt, that is the death knell. So while I have no doubt that gold is going to $3,000 and beyond, I have little doubt that gold is going lower over the next couple of weeks. Patience will be the name of the game!
CONCLUSION
We’re almost to the point where there is no port in the storm. Just six months ago we were looking toward China as the world’s new economic engine. Now it’s a different story. On Friday the Chinese government failed to sell all its bonds at auction, a sign of how cash has become increasingly tight in the slowing economy. The finance ministry sold only Rmb9.5bn ($1.5bn) of the Rmb15bn in government debt on offer, the first time in nearly two years that Beijing has fallen short of its target bond sale. The failure stemmed from a jump in money market rates that has occurred because the central bank has refused to pump liquidity into the economy despite signs of stress in the banking system. Analysts say the sudden tightness is the latest indication of how the government appears willing to tolerate slower growth on order to control some of the risks that have built up in the economy.
In Japan we saw the stock market give back 6% on Thursday alone, not the first sharp break we’ve seen in the last month, and I don’t think it will be the last. This happened in spite of the fact the Bank of Japan is currently engaged in a QE policy equal to over 25% of Japan’s economy. Then we have Brazil, a country where they can’t lower the growth projections fast enough to keep up with reality. That fact that they could put a country like Brazil in the same level as Russia, China and India shows you just how stupid analysts can be. Brazil has more than a trillion dollars in debt and there’s no way it can pay that off.
In the US we have a real dilemma. The economy is too weak to reduce QE, but QE is dragging the economy down. How can that be? Quite simply QE is debt and the more debt the Fed creates, the worse things will get. That’s why the Fed will cease QE and the deflationary spiral will accelerate as a consequence of its actions. What comes after QE? Helicopters! The so-called economic acceleration that is supposedly taken place is far from evident in the numbers. Although the payroll employment number for May was higher than expected, it was still well below the average of the prior six months. In addition, both average weekly earnings and hours worked were flat, a negative sign for income growth in the period ahead. Corporate hiring plans still remain weak.
Similarly, the perceived strength in consumer spending is also a case of wishful thinking. The latest monthly report shows declines in consumer spending of 0.2% and disposable income of 0.1% along with a savings rate of only 2.5%. Combined with the lack of growth in disposable income, wages, hours worked and hiring, the outlook for consumer spending remains tepid at best. Also adding to the economic malaise is the lowest reading in the ISM manufacturing index since June 2009 and weakness in the majority regional ISM and Fed regions.
All in all there is no doubt that economic growth will remain too sluggish for the Fed to cut its bond buying program as early as investors believe. They’ll stop issuing debt, but they’ll still have to provide the cash. Finally, I think that rather than reigniting the upward trend in the market, the focus of investors will shift to the weak economy and the disappointing earnings that are likely in the second half. The guidance being issued by an unusually large number of corporations already points in that direction, and as a result it is my belief that we are already at, or very close, to the market high for the year. Once the Dow rolls over, there will be nothing to hang your hat on. That’s when things will get very interesting.
Robert M. Williams
St. Andrews Investments, LLC
Nevada, USA
Copyright © 2013 Robert M. Williams - All Rights Reserved Disclaimer: The above is a matter of opinion provided for general information purposes only and is not intended as investment advice. Information and analysis above are derived from sources and utilising methods believed to be reliable, but we cannot accept responsibility for any losses you may incur as a result of this analysis. Individuals should consult with their personal financial advisors.
Robert M. Williams Archive |
© 2005-2022 http://www.MarketOracle.co.uk - The Market Oracle is a FREE Daily Financial Markets Analysis & Forecasting online publication.


