


Uranium Stocks Bearish Trend With Potential for Bottom Formation
Commodities / Uranium Mar 19, 2008 - 04:57 AM GMTBy: Merv_Burak
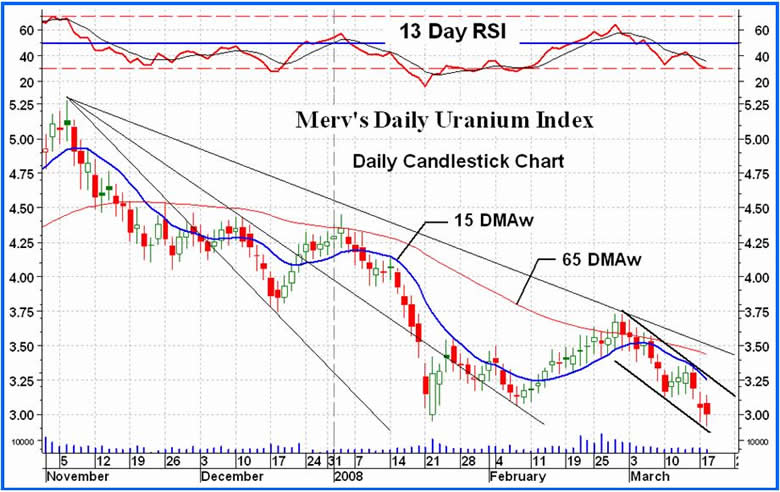
 Another downer of a day for the uranium stocks but looking at the chart it looks more like the start of a reversal activity than a continuation of a bear. Yes, the Index did close lower but the daily action stayed within the confines of yesterday's activity. A real down day would be a close below yesterday's low. Anyway, the Merv's Daily Uranium I ndex closed lower by 0.051 points or 1.67%. There were 20 winners, 25 losers and 5 unchanged.
That is a lot better than yesterday and is going in the right direction. Of the five largest stocks we had 3 winners and two losers, again better than yesterday. Cameco lost 1.6%, Denison lost 1.2%, First Uranium gained 1.7%, Paladin gained 1.7% and Uranium One gained 0.2%. The best of the Index was Western Prospector with a daily gain of 16.7% while the worst was Mawson Resources with a loss of 9.1%.
Nothing has changed from the intermediate term stand point. The Index is below its negative sloping moving average line and the momentum indicator is in its negative zone below its negative sloping trigger line. The intermediate term rating remains, as it has for some time now, BEARISH .
As for the short term, it too has not changed as far as the rating is concerned. The Index continues below its negative short term moving average line and the short term momentum indicator remains in its negative zone below its negative sloping trigger line. The indicator is sitting just on top of its oversold line but not quite in the oversold zone. Both the short and intermediate term momentum indicators remain above their levels from the January low continuing to give us the potential of a positive divergence. We need the Index to rally before the indicators go much lower for them to confirm such divergence. In the mean time the short term rating continues to be BEARISH .
After the close tomorrow, later in the evening, I will be posting a new table of technical information and ratings. I hope to make it a regular Wednesday thing. It will differ somewhat from the table posted on the weekend in that it is based upon daily data and a revision to some of the indicators. Watch for it later tomorrow evening.
By Merv Burak, CMT
Hudson Aero/Systems Inc.
Technical Information Group
for Technically Uranium with Merv
Web: http://techuranium.blogspot.com/
e-mail: merv@themarkettraders.com
During the day Merv practices his engineering profession as a Consulting Aerospace Engineer. Once the sun goes down and night descends upon the earth Merv dons his other hat as a Chartered Market Technician ( CMT ) and tries to decipher what's going on in the securities markets. As an underground surveyor in the gold mines of Canada 's Northwest Territories in his youth, Merv has a soft spot for the gold industry and has developed several Gold Indices reflecting different aspects of the industry. As a basically lazy individual Merv's driving focus is to KEEP IT SIMPLE .
This Blog is - A periodic review of the daily or weekly market action in uranium stocks. The review is strictly from the technical perspective. Merv is a pure market technician. Weekly, one will find a table of technical information and ratings of the 50 component stocks of the Merv's Uranium Index as well as a weekly summary of the uranium stock activity. Daily (most days), one will find a daily review of the market action of the Merv's Daily Uranium Index as well as technical analysis of one or more uranium stocks of interest.
Disclaimer - Technical analysis is not perfect. Should you expect perfection this is not the site for you.
Technical analysis IS a very sound technique to assess the daily or weekly trading activities in securities and to assess appropriate timing of investment activities. This blog provides such technical analysis of the trading activity in uranium stocks for your information. Any use made of this information is strictly at the users risk. No guarantees are made for the accuracy or potential for the information provided herein. Use at your own risk. You are strongly advised to check with your broker or investment adviser before activating any investment desisions.
Merv Burak Archive |
© 2005-2022 http://www.MarketOracle.co.uk - The Market Oracle is a FREE Daily Financial Markets Analysis & Forecasting online publication.